Thames Water, one of England’s many regional water monopolies, infamously privatised by Margaret Thatcher in…
The Changing Nature of Public Employment C. P. Chandrasekhar and Jayati Ghosh
In a previous edition of MacroScan, we considered trends in central government employment, and showed how the number of people employed by the central government stagnated between 2006 and 2014, while the number employed by central public sector enterprises declined. Furthermore, the number of vacancies in public employment increased sharply over this period, amounting to more than one-fifth of the number employed.
However, the labour force surveys provide a slightly different picture. These surveys capture all forms of employment at all levels of government (central, state, and local bodies as well as public enterprises) including not just those that the government officially recognises as employees, but also all scheme workers who self-describe as working for the government, even when the official registers do not include them and they do not receive many of the benefits normally accruing to public employees. For example, the labour force surveys include “voluntary” workers such as anganwadi workers and helpers and ASHAs who do not receive even minimum wages for their work, but nonetheless see themselves as regularly employed by the government.
As a result, the evidence from the labour force surveys shows that public employment actually increased in the period between 2011-12 and 2017-18. (In what follows, the shares of workers derived from the labour force surveys have been applied on population estimates for the relevant years, to get absolute changes in employment.) As Figure 1 shows, total public employment went up by nearly 200 lakh workers, which is definitely a very significant increase. This was distributed among both rural and urban areas, with the bigger increase in rural areas.
Of course, this means that the corresponding drop in private employment must have been even greater, which should be a source of great macroeconomic concern, but that is a separate story. Let us consider the pattern of the public employment generated over the period.
Figure 1: Total public employment increased in India between 2011-12 and 2017-18
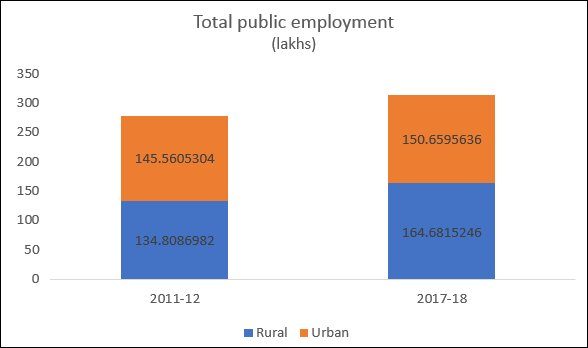
Figure 2: The big increase was in regular employment in rural areas
Figure 2a
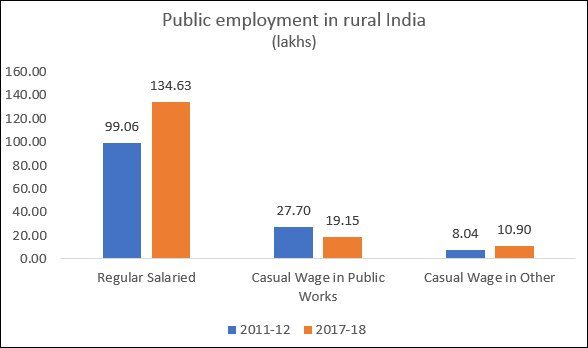
Figure 2b
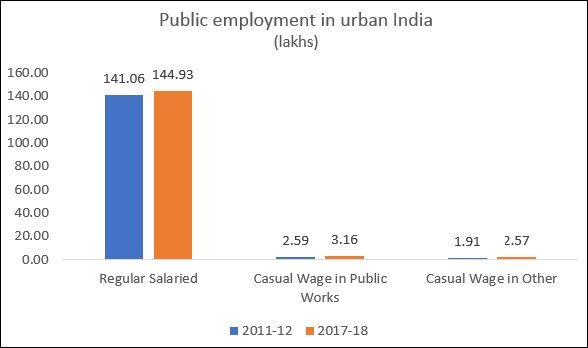
Figures 2a and 2b suggest that the bulk of the increase was in regular salaried employment. Indeed, casual employment in public works like the MNREGA actually appears to have fallen over this period. At first glance, this must surely appear to be a welcome development. After all, regular public employment is seen across Indian society as something much to be desired, for its security and foten hgher than markt wages for many functions. But this is where the description of regular employment may mislead, because the definition used by the NSSO surveys includes all those who see this as their regular occupation and receive some kind of monthly remuneration, even if this is not officially recognised as employment by the employer – the government.
Scheme workers, for example, are not recognised as public employees by the government, and are paid “honoraria” rather than wages – because most of them in fact receive well below the minimum wages. They also do not receive any of the usual benefits associated with government employment such as security of tenure, minimum wages, social security and so on. Often they do not even have proper written contracts.
Figure 3: Women’s share of regular public employment has increased –
but this need not reflect good working conditions
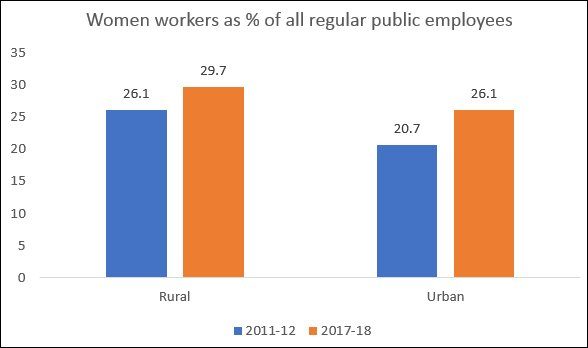
Figure 4: Rural women public workers are more likely to be
illiterate or with only basic education
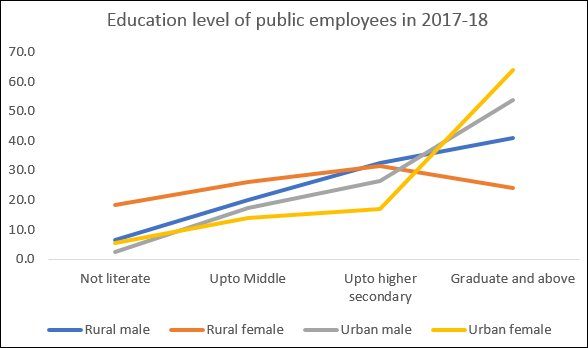
Indeed, as Figure 3 shows, most of the increase in regular public employment has been of women, in both rural and urban areas. Yet they are the ones who are more likely to be employed in these schemes, with well below minimum wages and very poor working conditions. Figure 4, which disaggregates public workers according to education level, underlines this point. In rural areas, around 45 per cent of regular women workers in public employment are either illiterate or have only basic education, suggesting that they must indeed be scheme workers. By contrast, in urban areas where fewer of such schemes are prevalent, women public workers are more likely to have higher levels of education.
Table 1: Average daily wages in public employment in 2017-18 (Rs)
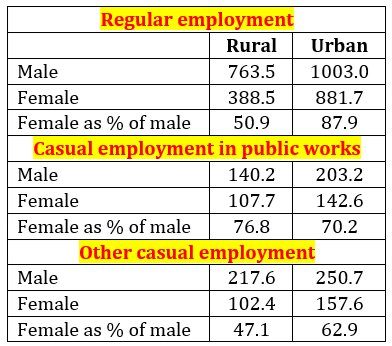
The gender wage gap in public employment further emphasises this point. The average wage received by women regular public workers in rural areas is only around half of that received by men- a shockingly large wage gap. Indeed, it is striking that the gender wage gap is much lower in public works, pointing to the role of the MNRGEA in reducing such gaps. However, even here, a sizeable gap exists, although not as extreme as that for regular public employment.
This suggests that the increase in public employment over this period need not really reflect a genuine expansion of good quality public services through the expansion of decent work by the government. Rather, it points to a continuation and intensification of a terrible failing of official policy in the past two decades: the attempt to provide essential social services on the cheap, by exploiting the underpaid labour of women.
(This article was originally published in the Business Line on October 5, 2019)