The World Trade Organization (WTO) has
recently published its latest annual report. It shows that even seven
years after the implementation of the Uruguay Round Agreements, distortions
and imbalances in world trade are still pervasive. The report highlights
that imbalances and distortions are particularly high in sectors where
developing countries have export interest.
In developed countries, agriculture is still receiving huge amount of
subsidies despite its small and declining share in domestic GDP. In 2002,
total support to agriculture in OECD countries was around US$ 311 billion,
which was equivalent to about 1.3 percent of total GDP of the OECD area.
The amount of agricultural subsidies is more than six times higher than
the annual development assistance budget of OECD countries, which is about
US $50 billion. In countries like Japan, Republic of Korea, Norway, and
Switzerland total support to agriculture is close to or exceeds the sector's
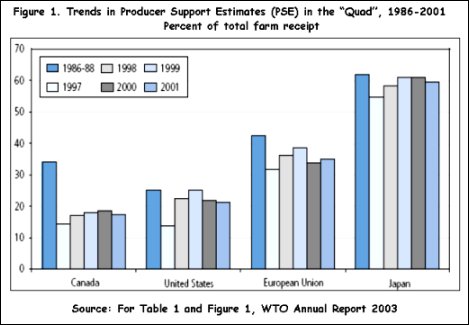
contribution to GDP (Table 1). From Figure 1 it can also be observed that
in all the Quad countries (EU, Canada, Japan and US), support given to
agriculture, when measured as a percentage of total farm receipts, is
higher in 2001 than in 1997.
|
||||||||||||||||||||||||||||||||||||||||||||||||||||||||||||||||||||||||||||||||||||||||||||||||||||||||||||||||||||||||||||||||||||||||||||||||||||||||||||||||||||||||||||||||
|
||||||||||||||||||||||||||||||||||||||||||||||||||||||||||||||||||||||||||||||||||||||||||||||||||||||||||||||||||||||||||||||||||||||||||||||||||||||||||||||||||||||||||||||||
The Annual Report also reveals that, contrary to popular belief, subsidies
in most developed countries are not targeted towards the poor farmers.
In fact, in most OECD countries, a very high proportion of subsidies goes
to the top 25 percent of farmers. Quoting an OECD study, the report highlights
that in EU, USA, Canada and Japan top 25 percent of farmers receive 70
percent, 89 percent, 75 percent and 68 percent of total agricultural subsidies
respectively. Data published in the Annual Report also contradict the
claim that OECD countries have mostly moved away from market distorting
subsidies like price support to relatively less market distorting subsidies
like Blue and Green box subsidies. Data show that market price support
is still prevalent in these countries as prices received by the OECD farmers
continues to be much higher than international prices. The producer Nominal
Protection Coefficient (NPC) of OECD countries shows that the prices received
by the OECD farmers were 31 percent higher than international prices in
2001. Estimates show that in 2001, highly trade distorting subsidies like
market price support (MPS) and output payments (OP), together accounted
for 69 percent of total support to producers in OECD countries. On this,
the WTO Annual Report 2003 comments:
"… the continued dominance of the most distortive forms of
support means that farmers in many OECD countries remain largely insulated
from world market signals. They also constrain agricultural growth and
development opportunities in non-OECD countries". Pp. 22.
Recent domestic policies undertaken in most OECD countries suggest that
high subsidization of agriculture is going to continue. The proposed reform
of Common Agricultural Policy (CAP) of EU has already run into problems
in countries like France and it is not yet certain whether and when the
CAP reforms will be eventually implemented. But even if the CAP reforms
are implemented, the WTO Annual Report suggests that the total EU farm
budget will be around €40 billon. However, the report also mentions
that this figure does not include subsidies given to farmers via price
support and tax concessions. As has been already mentioned, farmers in
all the OECD countries, including the EU countries, continue to receive
generous price support from their respective governments. Once these subsidies
are added to the figure of €40 billon, it is not clear how much actual
reduction in subsidies is going to take place even after the CAP reforms
are implemented.
Secondly, USA, through its Farm Security and Rural Investment Act of 2002,
has proposed to increase its agricultural subsidies significantly. Under
this law, federal spending on US agriculture is slated to increase by
US$ 82.6 billion over the next ten years. This will be in addition to
US$ 100 billion which the US Government was already set to give farmers.
The WTO Annual Report indicates that this huge increase in subsidies primarily
will be in production enhancing subsidies. It says: "several of the
subsidies contained in the bill would provide incentives to boost production.
This is particularly true of "counter-cyclical payments", under
which growers of wheat, corn, rice, soyabeans, and cotton will be guaranteed
a certain price irrespective of market conditions, thereby distorting
both production and trade; in the event that prices fall further, such
subsidies will rise accordingly, although a "circuit breaker"
built into the legislation is designed to keep spending within the WTO
ceiling". Pp. 22.
This large increase in production enhancing subsidies in the US is likely
to exacerbate the distortions present in global agricultural trade by
artificially inducing overproduction of agricultural commodities and thereby
further depressing international agricultural prices. After the Uruguay
Round, most developed countries increased their farm subsidies but they
did so by shifting some of their more production distorting subsidies
(or the Amber Box subsidies) to Blue and Green box subsidies, which are
supposedly less trade distorting. But, as USA is now planning to increase
their production enhancing subsidies by a huge amount, it is almost certain
that distortions and imbalances of the international agricultural trade
are going to go up in near future.
The new US farm bill also marks a crucial shift in the negotiating position
of USA in the current round of agricultural negotiations. During the earlier
stages of negotiations, USA was arguing for sharp reduction in domestic
subsidies while the EU was arguing for a more conservative approach. But,
given the new US farm bill, it is almost certain that USA will no longer
push for a large reduction in domestic subsidies in the current round
of negotiations. This has changed the balance of negotiations completely
and there is currently an apprehension among developing countries that
reluctance of these two major players to reduce domestic subsidies will
practically preempt any move by other WTO Member countries to achieve
higher reduction in domestic subsidies in the next agreement on agriculture.
A recent joint draft proposal submitted by USA and EU about the ongoing
agricultural negotiations strengthens this apprehension[1].
The WTO Annual Report also points out that apart from high subsidies,
existence of tariff peaks[2] and high specific duties
in developed countries continue to restrict market access of agricultural
exports from developing countries. According to the WTO Annual Report,
incidences of tariff peaks are particularly high in the agriculture sector
of these countries. Estimates suggest that roughly 60 percent of the imports
of the QUAD countries, which face tariff peaks, come from developing countries.
Most developed countries also use specific duties for agricultural imports
(see Box 1 for an explanation of specific duty). Specific duties are inherently
more problematic than ad valorem rates because they are more opaque than
Ad Valorem tariffs and often conceal a very high level of Ad Valorem Equivalent
(AVE)[3]. The WTO Annual Report reveals that "between
94 and 98 of the top 100 tariffs (in AVE terms) in Canada, the EU and
Japan involve specific duties; they range from 61% to nearly 210% in the
EU, from 47% to roughly 1,739% in Japan, and from 56% to 314% in Canada.
In the United States, 84 of the top 100 tariffs involved specific duties
whose AVEs ranged from 34 to nearly 253%". Pp 17.
|
As far as market access for non agricultural goods are concerned, the
WTO Annual report shows that among manufactured products, tariff peaks
are concentrated in textiles, clothing and footwear sectors. For both
developed and developing countries, bound rates are highest in textiles
and clothing, leather, rubber, footwear and leather products. Tariff rates
are higher than average in fish and fish products and transport equipments
also. It is not a coincidence that sectors where the developing countries
have export interest are attracting much higher tariff rates.
Widespread existence of tariff escalations also hinders exports from developing
countries. In most developed countries for both agricultural and industrial
goods, tariffs tend to increase with the level of processing. This is
called 'tariff escalation'. Tariff escalation discourages exports of value
added commodities and locks developing countries in the cycle of producing
and exporting primary products and restricts them from diversifying towards
more value added exports. It also acts as a major obstacle to local processing
of domestic primary products (stage 1) as well as of semi-finished goods
(stage 2). The WTO Annual report shows that, among industrial products,
incidence of tariff escalation is particularly high in textiles and clothing,
leather and footwear products. The WTO Annual Report also points out that
in the textiles and clothing sector there is evidence of escalation in
non-tariff protection (greater protection given to higher value-added
products through non-tariff barriers). Quoting the report of WTO Textile
Monitoring Body, the report shows that in the textiles sector, most developed
countries have removed quota restrictions mainly on products which belong
to the lower value-added range. As the Annual Report comments, such protection
impedes developing countries in their efforts to move their production
into higher value-added products.
To further restrict market access in their countries, developed countries
are increasingly using trade defense mechanisms as Non Tariff Measures.
The Annual Report shows that protectionist measures taken by WTO Member
countries have gone up in the recent years. The steady increase in trade
defense mechanisms like anti-dumping duties, countervailing measures and
safeguards leads to the suspicion that these measures are increasingly
used as Non-Tariff Measures (NTMs) by the member countries. For example,
the number of cases of initiation of Anti-dumping measures increased steadily
from 157 in 1995 to 347 in 2001. More than half of the anti-dumping measures
imposed by WTO member countries are directed towards two categories of
products, namely 'base metals and articles thereof' and 'chemicals and
articles'. Secondly, the use of SPS (Sanitary and Phytosanitary Measures)
and TBT (Technical Barriers to Trade) have also increased steadily over
the years. There is a growing concern among developing countries that
these measures are used by developed countries to restrict market access.
The report also points out that instances of WTO members resorting to
other trade defense mechanisms like safeguards and countervailing measures
are also on the rise in the recent years.
These findings are particularly disconcerting for developing countries
because implementation experiences show that the Uruguay Round did not
bring any fundamental changes in the global trading system. As the WTO
Annual Report points out, continued presence of high level of subsidies
in agriculture, backloading of quotas in textiles and lack of meaningful
liberalization in the services sector have ensured that the benefits accruing
to the developing countries are much less than anticipated. Given this
backdrop, this new trend of increased use of trade defense mechanisms
is going to be a serious cause for concern for developing countries. Continued
deadlocks in the current round of negotiations are not helping the matter
either.
Given these problems, it is not surprising that the optimism about the
multilateral trading system is gradually fading in most developing countries.
As an alternative, most countries are trying to improve their trade relations
on bilateral or regional basis. Consequently, there has been a proliferation
of Regional Trading Agreements (RTAs) among developing countries in the
recent years. According to the WTO Annual Report, currently more than
240 RTAs are operational and as the last years' Annual Report pointed
out, more than 50 percent of global trade now takes place through the
regional trading groups. It is to be noted here that trading within RTAs
does not come under the purview of WTO and, therefore, these regional
alternatives are posing a significant challenge to the multilateral trading
system. The WTO Annual Report 2003 expresses deep concern about this latest
development and comments: "RTAs can complement the multilateral trading
system, help to build and strengthen it. But by their very nature RTAs
are discriminatory; they are a departure from the MFN principle, a cornerstone
of the multilateral trading system. Their effects on global trade liberalization
and economic growth are not clear given that the regional economic impact
of RTAs is ex ante inherently ambiguous".
However, unless the Cancun Ministerial manages to address the concerns
of the developing countries, it is unlikely that the growth and proliferation
of RTAs are going to subside. In fact, failure of the Cancun ministerial
may even drive countries more towards alternative forms of international
trading systems.
The Complete Report can be Downloaded/Viewed at:
http://www.wto.org/english/res_e/booksp_e/anrep_e/anrep03_e.pdf