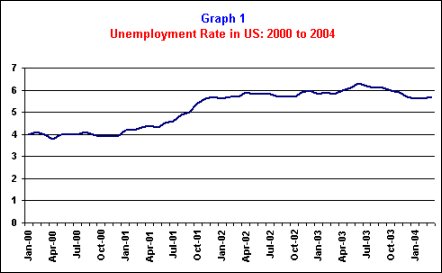
The present recession in the US economy has been notably different from previous episodes of economic slump in atleast two ways. Firstly, the growth in employment which started falling since early 2001 continued to fall even during the first quarter of January, 2004. In the year 2001 alone, there were1.5 million net jobs lost according to official estimates on payroll employment. The following year added less than 0.4 million jobs. Employment growth during 2003 has been inadequate to make up for the massive job-losses of the previous two years. The situation in the opening months of 2004 has see-sawed so far (see Table 1). The slowest to respond has been the manufacturing sector, which actually triggered the recession when the boom in the IT sector burst at the end of the 1990s. In all the 21 industries that constitute manufacturing sector, employment declined, and 17 of the 21 saw losses exceeding 10%. Congressional budget office estimates the manufacturing sector net jobloss to be 3 million between July 2000 and January 2004 [1]. This has brought down the employment in manufacturing down to 14.3 million, lowest since July 1950. Unemployment rates that had dipped below 4% during the late 1990s shot up to above 6% (see Graph 1). Analysts say that even this high rate might be a conservative estimate since there are scores of people who faced with long periods of unemployment have stopped reporting themselves as part of the labour force [2]. Thus the employment situation is adverse not only because of the severe intensity of the jobloss but also due to the extended period during which the employment situation has worsened. The present cycle is one of the longest lasting declines in employment since 1933.
|
|||||||||||||||||||||||||||||||||||||||||||||||||||||||||||||||||||||||||||||||||||||||||||||||||
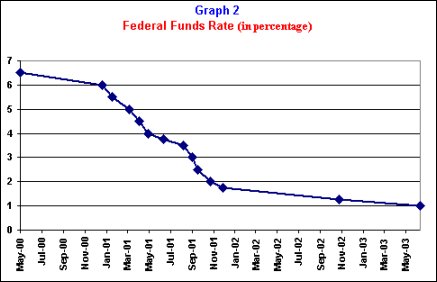
The second tendency, which makes the present US recession distinct from earlier periods of recession, is the enormous fiscal and monetary stimulus being provided by the Federal government. Direct demand injection in the form of substantial increases in defense and defense-related expenditure, orchestrated through the war against terrorism, has supplemented traditional supply side measures. The latter include substantial reduction in interest rates (see Graph 2) and major tax cuts. Probably for the first time ever, massive increases in war expenditure by the US government were accompanied by heavy tax relief [3].
|
|
|
|
The following paragraphs explore the unemployment issue in some detail. Why despite a turnaround in output growth evident since 2002/3, did the employment growth continue to drag behind? [4] Our method would be to analyse the patterns of expenditure in the two major sectors government and private business and relate it to the puzzle of slow employment growth.
|
|
|
|
Government
Spending
Military-fuelled growth, or military Keynesianism,
was first theorised by Kalecki in 1943. Kalecki argued
that capitalists and their political champions tended
to bridle against classic Keynesianism; achieving full
employment through public spending made them nervous
because it risked over-empowering the working class
and the unions. The military was a much more desirable
investment from their point of view, although
justifying such a diversion of public funds required a
certain degree of political repression, best achieved
through appeals to patriotism and fear-mongering about
an enemy threat - and, inexorably, an actual war
[5].
The neo-liberal right wing in the US has adopted the
strategy of military Keynesianism with much
enthusiasm. Between 2002 and 2004, total budgetary
outlay grew at an annual rate of 7-8%, up from an
average of 3.46% during 1991-9. National defense
expenditure which had been declining in absolute terms
every year since the end of Cold War, registered an
annual growth of 12-17% between 2002 and 2004.
Including the costs of two major military operations
in Afghanistan and Iraq, the US defense budget
increased from $300 billion in the year 2000 to $460
billion in 2004, i.e., by 52.9%.
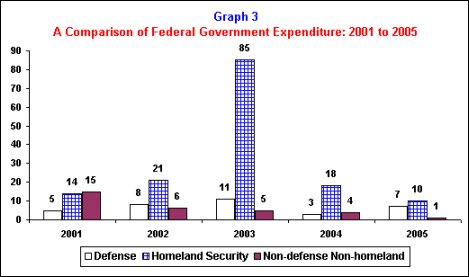
Department of homeland security is another area
where resources have flown generously. On March 1,
2003, approximately 1.8 lakh personnel from 22
different organizations around the government became
part of the Department of Homeland Security, whose
mission was to make America more secure. 17 of the 19
budget functions contain at least some funding for
homeland security activities. The Presidents budget
for 2005, includes $47.4 billion as resources for
homeland security activities, a 15% increase over 2004
level and a 130% increase over 2002. If we compare
these figures with other budgetary allocations, say
the estimated outlays on Education, Training,
Employment, & Social Services (Function 500) or
Community and regional development (Function 450),
over 2004 and 2005, outlay on Function 500 is
estimated to increase by $1.8 billion (2%) to reach a
level of $89 billion, whereas outlay on Function 450
would actually fall in absolute terms by $1.7 billion
to reach a level of $17 billion. Obviously, the
disproportionately large spending on defense and
related activities to combat the supposed threat of
terrorism is being made up through cuts in spending on
social sector, infrastructure, development and other
heads. (see Graph 3)
|
|
|
|
What as been
the underlying pattern of employment generation of
this nature of public spending?
The rising level of sophistication of defense
equipment and overall defense systems has meant rising
capital intensity of production and consequently
falling job-creation capacity of defense spending. A
report in the Washington post in 1986 wrote that 1 out
of every 20 jobs in the US were directly or indirectly
related to military spending [6].
More recent estimates say that this percentage has
dropped to 3.2% [7].
Military expenditure, which has always been extremely
capital intensive has become even more so. Reports
widely speak of absence of new recruits of military
personnel even during the war on Afghanistan and Iraq.
In the absence of direct recruitment of military
personnel by the Pentagon, the route by which defense
expenditure can generate employment is through defense
contractors. The heavy government outlays on security,
military operations, and other types of defense
expenditure have financed multi-billion dollar
contracts to politically-connected giant corporations.
The largest of these contracts would be more than $20
billion, and the average one would be atleast a few
billions. In fact, each of these contracts has the
capacity to regenerate the economy of an entire
region. For instance, the $4 billion contract awarded
to the California company Northrop Grumman to work on
the Star Wars missile defense program, has a
possibility to regenerate several of the computer
firms, as much of the modern security paraphernalia
depends on Silicon Valley computer technology.
To what extent the contracts translate into real
production and employment boosters would of course
depend on the extent of excess capacity and inventory
holdings of these firms. Most of the orders for
supplies of tanks, ordnance, missiles, shipbuilding,
aircraft, engines, computer technology would be
enforced over a longish period of time and therefore
involve considerable production lags. Research on
defense systems, including homeland security, a major
contributor to the increments in defense budget
similarly has a long gestation period. In the
short-run, there is less chance of many of these
spending heads stimulating production and employment
significantly.
War profiteering has raised the profit margins of
defense contractors enormously [8].
Yet the transmission from very high profits to higher
employment is not at all obvious. A case in point is
General Dynamics, one of the top 5 military
contractors. Between 1991 and 1993, stock price of the
company rose 553%, but General Dynamics downsized its
workforce in the early 1990s by 80% from 1,02,000 to
21,000
[9].
Overseas defense spending on war and occupation of
Afghanistan automatically represents leakage from US
public spending and would therefore lower the
multiplier effect of public spending. For instance,
the present state of affairs in Iraq has forced the
giant corporations engaged in reconstruction work to
employ security persons to the tune of 200,000 for its
staff, which would mean an additional cost of $1
billion! However, there are two factors that have
prevented the overseas factor from becoming too strong
a force in pulling down domestic employment. One, the
actual war or the reconstruction budget was only a
relatively small part of the overall rise in defense
spending. Second, barring physical constraints that
would encourage the US firms in Iraq and Afghanistan
to spend locally, US contractors have been found to
place a lot of the reconstruction orders with their
offices in the US. Bechtel, the engineering giant was
awarded a $680 million contract to evaluate and repair
Iraq's power, water and sewage systems. The work has
mainly been assigned to its offices in the US.
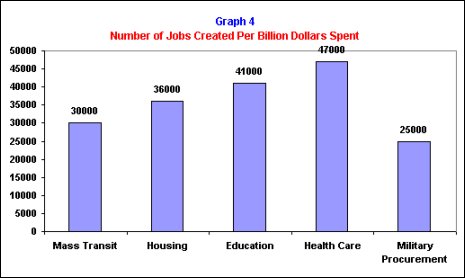
Finally, in comparison to military expenditure the
job creation capacity of various other sectors that
are part of federal governments budgetary functions
is much higher (see Graph 4). Thus as far as jobs are
concerned, military spending is a much worse
investment than other federally funded programme. The
new orientation of the US budget with cuts for
non-homeland non-defense functions, would have caused
some erosion of employment growth.
|
|
|
|
Private
Business Spending
The private business sector is in the peculiar
position of being responsible for the massive
job-loss, and yet structural constraints have
prevented generation of any fresh stimulus from within
the industrial sector, especially manufacturing. Table
2 compares the contribution to real GDP growth by
various national income categories for the three years
2001 to 2003. It can be clearly observed that for two
consecutive years, 2001 and 2002, contribution to real
GDP growth of gross non-residential private domestic
investment was negative. But for the steady expansion
of personal consumption spending and public spending,
the repercussions for real output growth would have
been much more severe during the recession years.
|
|||||||||||||||||||||||||||||||||||||||||||||||||||||||||||||||||||||||||||||||||||||
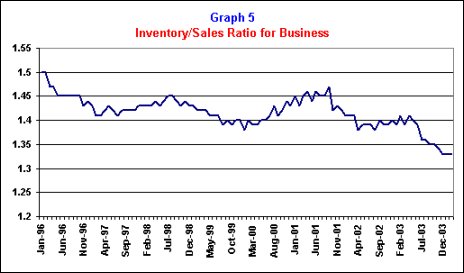
Private business spending has been slow to respond to monetary stimulus by the Fed. Since May 2000, the Federal funds rate was eased 13 times and by some 550 basis points (refer to Graph 2). The reason why the comfortable liquidity position failed to revive investment in capacity has to do with the level of capacity utilization of US industries. Average capacity utilization rate during 1993-2000 was 82.4% for all industries, which fell steadily since May/June 2000 to reach a trough of 74.4% by Dec.2001 and has remained between 74-76 % eversince. Even after the demand for industrial goods started picking up, firm managers have preferred to run-down inventory stocks rather than increasing capacity utilization. This is reflected in the declining inventory/sales ratio which has continued to fall in the first quarter of 2004 to reach the lowest level in the past 8 years (see Graph 5). In such a scenario, employment growth in industry would automatically be sluggish.
|
|
|
|
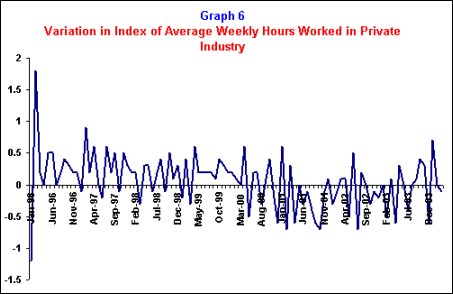
To avoid hiring workers, US firm managers have also encouraged existing workers to work extra hours. Just like the slack in capacity, there appears to be a slack in labour use. The average working hours of workers in private industry that had dropped during the course of the recession is now beginning to climb up (see the slightly upward trend in Graph 6 in the recent months). Adjustment by employers of laying-off the less productive workers during the downturn, has supposedly, resulted in increased productivity such that the same output now requires less labour hours [10].
|
|
|
|
|
|
During the 1990s the
development of the manufacturing sector in the
United States was led particularly by the growth in
computers and electronic products. In 1990, the
computer and electronic products industry accounted
for 5 percent of real total manufacturing output. By
2001, its real share had grown to 28 percent a
more than fivefold increase. To a great extent, the
tremendous growth in the computer and electronic
products industry through 2001 masked declines in
other manufacturing industries. With growth,
however, came greater vulnerability to changes in
the fortunes of this particular industry. When the
bubble burst in the demand for semiconductors,
computers and telecommunications equipment in late
2000 and early 2001, workers throughout the United
States were laid off, generating ripple effects that
extended throughout manufacturing and the broader
economy. Approximately 19 percent of the 2.4 million
jobs lost in manufacturing sector since March 2001
were shed in the computer and electronic products
industry [11]. Another
11 percent of these 2.4 million jobs were lost in
the machinery industry a sector which includes
semiconductor processing equipment. Hence, while
manufacturing employment was buoyed by increased
demand for high-technology products in the nineties,
it now suffers the flipside of this relationship
the downturn in the global demand for computers and
electronic products has contributed in large part to
the overall slow pace of recovery.
Another structural shift in US manufacturing
industries has been the rising competition from
cheap imports especially from China. Imports as a
share of total demand for manufactured goods in the
U.S. has increased steadily over the past few
decades, and this trend continues. Between 1997 and
2003 this share increased from 17 percent to 26
percent [12]. China has
been competing in industries such as textiles,
stuffed toys, metal-furnitures etc, industries that
are labour-intensive. Though analysts assure that
U.S. manufactures are concentrated in capital goods
industry, and trade-related lay-offs have been
negligible during this recession
[13], the strong Chinese presence in the
labour-intensive sectors does add to the downslide
of manufacturing employment.
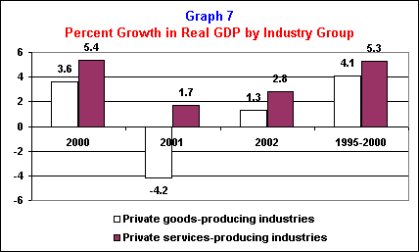
Manufacturing sector jobs in USA account for only
12% of employed workforce. An overwhelming
proportion of the jobs are now in the service
sector: service jobs account for more than 80% of
the total employment and 78% of GDP. The services
witnessed low but non-negative growth in real GDP
during the first two years of recession.(see Graph
7) Net jobs lost in the private service sector
between 2001 and 2003 was 0.3 million (based on BLS
data), which is 1/8th of the job-loss in the
manufacturing sector over a similar period. Recent
reports speak of a continuing streak of robust
growth of the service sector over the past 13
month-period[14].
|
|
|
|
Just as manufacturing jobs
have been threatened by import competition from
China, an imminent threat to service-sector jobs in
the US arises from business process outsourcing to
countries such as India. The present recession has
been an opportune moment for many large service
industries to move their operations offshore in
search of cheap labour resources. In a static sense
this has implied fewer jobs for US citizens. But the
corporates assure that the long-run effects of lower
labour costs and therefore higher profit margin
would show up in higher profitability and lower
average prices for the Americans. Forrester
Research, a consultancy, guesses that 3.3m American
service-industry jobs will have gone overseas by
2015.
Obviously there is clash of interest here: the US
multinational lobby is pushing aggressively for more
overseas-based operations so that labour costs are
minimized, while the domestic worker unions are
fighting to retain these jobs within USA in an
already job-scarce economy. The developing country
governments like India look upon the outsourced jobs
as reciprocal gains for opening their economies to
both free trade and investment flows from developed
countries. The recent legislations against
outsourcing imposed by several state governments in
the US have invited sharp criticism. Raising
protectionist barriers would reduce the employment
opportunities for workers in the developing
countries.
It must be mentioned here that social safety net, an
essential buffer against economic cycles has been
steadily withering away in the US. This has
considerably added to the woes of the workers and
their families. Unemployment insurance which is the
only state programme worth its name has benefited
less than 40% of the jobless workers during 2000/1
[15]. Many states have raised the minimum
qualification for unemployment insurance to
ridiculously high levels. The root of the problem,
the state governments complain, lies in the
inadequate financial resources that have kept the
present unemployment benefits way below the 1991
level, not to speak of the levels during the
recessions of mid 1970s or the early 1980s.
US government largesse on military is not only
devastating poor developing nations, but also
destroying the lives of ordinary Americans.