While the annual trade figures released
by the World Trade Organization for 2003 points to strengthening recovery
in global trade and an optimistic outlook on prospects for further trade
expansion,[1] an analysis of medium-term developments
in global trade patterns suggests that even an expanding world trade scenario
may not be as promising or neutral in its implications for the prospects
for developing countries' trade expansion.
The medium-term developments in global trade provided in a report that
forms part of a broader WTO annual study titled "World Trade Report
2004", highlights two significant areas in which international trade
patterns have experienced major structural changes at the disaggregated
product level over the past two decades (1985-2003)[2].
Along with the fact that contrary to general perception, growth in services
trade no longer outstrips that in goods, there is a shift in agricultural
trade to processed products, away from commodities.
It is argued in this review that these structural shifts would have critical
implications for the prospects of developing and less developed countries
to expand their market shares in world trade. The first section will give
a brief overview of the global trade trends in 2003, following which the
structural shifts in services and agricultural trade patterns are examined
for their implications.
Trade Trends in 2003
According to the annual trade figures released by the World Trade Organization,
despite being one of the more disruptive years in recent times, 2003 proved
a good year for the world economy. A 2.5% increase in global output, propelled
mainly by higher than expected economic growth in Asia and the United
States, spurred world trade to recover by an average real increase of
4.5% in 2003. This was stronger than expected a year ago after the outbreak
of SARS and the US-led war in Iraq in early 2003. In addition to the fact
that this strengthens the global trade recovery in 2002 from the sharp
decline in the preceding year, the projection is that 2004 also looks
promising for further trade expansion[3].These
annual estimates from the WTO offer an optimistic outlook on world trade
prospects.
Trade growth exceeded output growth by an atypically small margin in 2003
when compared to the 1990s, when average trade expansion was 6.5%, approximately
twice as fast as merchandise output growth. It is partly because of the
end of the information technology sector boom which was the most dynamic
segment in world trade over the 1990s, that the typical excess of trade
over output growth was unusually small in 2002 and 2003. However, as in
2002, trade acceleration in 2003 was much stronger in dollar values than
in real terms[4].
The nominal value of world merchandise exports rose by as much as 16%
to $7.3 trillion and commercial services exports expanded by 12% to $1.8
trillion in 2003. Both these were the strongest annual increase in nominal
terms since 1995.
This difference between the nominal and real trade growth rates reflected
the major role played by exchange rate changes and commodity price rises
in inflating dollar trade values. For the first time since 1995, dollar
prices increased for both agricultural and manufactured products in 2003.
It is estimated that on the global average, prices of manufactured goods
rose by nearly 10 per cent, the first annual increase since 1995. Similarly,
fuel prices were up by 16 per cent, boosted by temporary supply shortfalls
linked to the conflict in the Middle East and civil unrest in Venezuela,
as well as due to increased oil demand from the US and a booming Chinese
economy. On average, the prices of non-fuel commodities also rose by 7
per cent on spot markets, including a 12% increase in metal prices.
The combined effect of these price rises and exchange rate changes involving
dollar depreciation against major currencies led to a 10.5% strengthening
of world merchandise trade prices in 2003. Thus, the large increase registered
by merchandise trade in nominal terms was a reflection of this.
Meanwhile, commercial services trade, which accounts for about one-fifth
of world trade in goods and services, also expanded by 12% in 2003. Even
though this was the strongest increase since 1995, services grew less
rapidly than merchandise trade in 2003 in contrast to the preceding two
years (2001 and 2002).
The influence of price and exchange rate effects on nominal merchandise
trade differed sharply by region, depending upon the sectoral distribution
of exports as well as the exchange rate regimes adopted by the various
economies. In general, nominal export growth in excess of 20 per cent
was recorded by many oil exporting countries (e.g. Russia and Saudi Arabia)
and in countries with strongly appreciating currencies, in particular
in Western Europe. Two thirds of the nominal rise in the Middle East's
exports was accounted for by higher oil prices. In Africa too, merchandise
exports of oil exporters (and South Africa) expanded at a greater rate
than the majority of non-oil exporting countries. But, while the share
of Africa in world merchandise exports increased in 2003, at 2.3% it remained
below the level recorded ten years ago.
Exchange rate changes had the most significant influence on trade values
in the case of Western Europe. Despite a near stagnation in volume terms,
there was a 17% increase in Western Europe's merchandise dollar export
value. This was almost entirely due to the price effects of the strength
of the euro and other European currencies vis-à-vis the US dollar,
as its trade in fact reported a small decrease when measured in euro terms.
For the third year in a row, the transition economies recorded the greatest
merchandise output and trade growth of all regions in 2003, facilitated
by a combination of strong currencies, higher fuel prices, strong regional
demand (including from Russia), and rising FDI inflows due to their deepening
westward integration.
The lowest export growth in dollar values was reported for North America
and Lain America. Interestingly, after the stagnant growth in 2002, Latin
America's exports rose by 4.5%, sustained mainly by a recovery in demand
for primary products from Asia.
Asia is the only region where price changes accounted for less than one-third
of the increase in dollar value of the region's merchandise exports. Significantly,
Asia's merchandise trade was driven strongly by the expansion not only
of China's trade, but also intra-Asian trade. With its imports growing
at 40% and exports at 35% in nominal dollar terms, China's trade expansion
was unprecedented for a country with such substantial trade volume. Its
export and import expansion was most outstanding particularly in office
machinery and telecom equipment segment.
Although more detailed data, especially on intra-Asian trade, is required
for making conclusive observations, the above trend points towards the
increased integration of China into the electronics sector production
networks, regionally and internationally. The large flow of capital goods
to China highlighted by the report as financed by strong FDI inflows related
to the relocation of manufacturing assembly operations and the recovery
in the electronics industry, does appear to support this observation.
In fact, this in itself may explain the large expansion in intra-Asian
trade. For example, according to the WTO, the higher than regional average
trade growth recorded by the Republic of Korea was owing to a sharp rise
in its exports to China linked to the recovery of the IT sector. The accelerated
growth in Asia's largest economies driven by a recovery in the electronics
and IT sectors thus may have provided a major stimulus to regional trade
expansion. In addition, the 2.7% GDP growth in Japan after years of recession
also contributed to the momentum in Asian trade.
Meanwhile, for the first time, China's imports exceeded those of Japan,
and China currently ranks number three among the world's leading merchandise
importers. The increased and heavy dependence on Chinese economic expansion
that this implies for sustaining global trade growth has serious implications
for world economic growth prospects.
Additionally, for the third successive year, United States import growth
exceeded the world average and continued to be a significant factor in
mitigating sluggish world trade growth. Thus, the fact that US import
growth continues to exceed export growth, widening its trade deficit further,
also continues to be a factor causing uncertainty about the sustainability
of world trade growth.
While all regions recorded stronger nominal export and import growth in
2003 compared to 2002 in the case of merchandise trade, in services trade,
Asia's exports are estimated to have expanded at a lower rate than in
2002. While Asia and Latin America's export expansion was limited to 6
per cent, Western Europe and the transition economies recorded annual
gains ranging from 16 per cent to 21 per cent boosted by the strength
of their currencies vis-à-vis the dollar. Thus, gains in the ranking
of the leading commercial services traders in 2003 were recorded principally
by West European countries and transition economies at the expense of
American and Asian countries.
Clearly, the annual data for 2003 was impacted by temporary and cyclical
factors which tend to affect a single year's data. Thus, shifting the
focus towards medium-term structural changes at the disaggregated product
level, we can better decipher the underlying structural pattern influencing
these trends.
Structural Shifts in Global Trade: Medium-term Trends
in Manufacturing and Services Trade
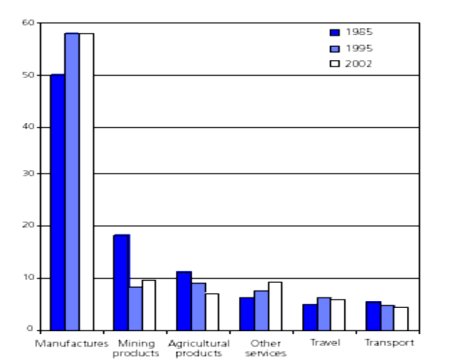
A summary of world trade developments by six broad sectors for the period
1985-2002 as provided in the WTO report of June is reproduced in the Chart
below. As this report points out, while at the aggregate level services
and merchandise trade growth have evolved in a roughly similar way since
1990, developments are more varied at a disaggregated level.
It reveals that since 1985, transport services as well as agricultural
and mining products among merchandise product groups expanded less rapidly
than world trade. Thus, while the share of the travel category rose between
1985 and 1995, it decreased thereafter. In contrast, trade in manufactured
goods and the "other" services category was more dynamic, showing
steadily increasing shares over the period. Among all product and services
categories, the share of mining products shows the biggest variations
owing to the impact of fluctuating oil prices throughout the 1985-2002
period.
Thus, overall, there is no indication that services categories in general
have increased their share in international trade and the latter continues
to be dominated by manufactured products to the extent of 75%. This implies
that manufacturing sector capabilities will strongly dominate the prospects
of developing and less developed countries' ability to increase their
shares in global trade.
A further breakdown of the fast growing world exports of manufactured
goods however reveals that the most dynamic product subcategory by far
has been office and telecom equipment, which expanded at twice the rate
observed for total manufactured goods in the 1990s. Consequently, its
share gained five percentage points between 1990 and 2000 and accounted
for 12.1 per cent of world merchandise and services exports. In fact,
the gains of this group exceeded the gains made by all manufactured goods
combined. Even though the crisis in the IT sector in 2000 arrested this
trend and the share of the sector in total manufactures has stagnated
since then, it continues to be one of the three largest manufactured export
segments, along with other machinery and equipment as well as chemicals.
Among the other subcategories of manufactured goods, iron and steel products
and textiles products recorded below average trade growth in the 1990s,
and showed a significant decline in their share in world trade over the
1990-2002 period.
These trends clearly point towards rising concentration of global trade
not only in manufactured products, but within manufacturing into an increasingly
narrow range of products such as machinery and equipment and chemicals.
Chart: Share of major goods and services categories
in world exports (a), 1985-2002.
(Percentage)
|
|
a Goods and commercial
services exports combined. |
Source: WTO, International
Trade Statistics, 2003. |
However, import liberalisation that has been occurring in the manufactured
sector through tariff reduction under the non-agricultural market access
(NAMA) negotiations, and restrictions on industrial policy options brought
in through trade-related investment measures (TRIMs) have been rapidly
eroding the South's capability to establish indigenously founded export-oriented
manufacturing sectors, which can withstand shifts in competitive advantages.
Further, the pattern of global foreign direct investment (FDI) shows that
machinery & equipment and chemicals industries have also been the
largest FDI recipients throughout the 1990s. This means that most of the
benefits of the dynamism in world trade in manufactures will be appropriated
by the MNC firms involved in the world-wide manufacturing sector production
networks.
The trends provided by the report regarding services trade also suggest
gloomy prospects for the South, despite alluring promises being made in
services trade negotiations under the GATS, regarding the opportunities
for developing countries to expand their export revenues through services
exports.
In 2003, commercial service exports as a whole was dominated by the US,
UK, Germany, France, Japan and other West European countries. In fact,
Western Europe alone constitutes about one half of world commercial services
exports. Among the select few developing countries which had a presence
among the top 30 leading commercial services exporters' list last year,
only China and Hong Kong accounted for shares of 2.5% each in the total.
The others such as South Korea, Singapore, India, Greece, Taiwan Province of China, Turkey,
Russia, Thailand, Malaysia and Mexico all had shares ranging only between
2% to 0.7%.
At the same time, a larger number of developing countries were present
among the top 30 leading importers of services in 2003. Even for China,
which has emerged as the largest services exporter among developing countries,
imports of commercial services continued to exceed its exports in 2003.
Only Hong Kong recorded a significant net surplus in services trade, while
Singapore and India also recorded some minor surplus in 2003. In general,
net gains from trade in services appear to be in the deficit for the large
majority of even leading developing country service exporters. The reason
behind this may be found in the medium-term trends in commercial services
trade.
Even though detailed statistics on commercial services trade are not yet
systematically available, on the basis of a sample of large services traders,
the report indicates a few sub-categories of international services trade
which report outstandingly strong export growth between 1995 and 2002.
These subcategories comprise (in descending order of their estimated growth
rate) computer and information services, financial services, insurance,
personal, cultural, and recreational services; and royalties and licence
fees[5].
It can be seen that almost all of these, especially the fastest growing
IT and financial services, are dominated by developed country firms. It
is evident that the level of sophistication required to compete in the
markets for these services will not be within the reach of the majority
of middle and low-income countries.
Thus, if the developing countries succumb to the pressure in the ongoing
GATS negotiations, to change the ownership and delivery of services in
their countries through its massive deregulation and privatization agenda
covering the entire scope of services, it will only help the developed
country transnational corporations to secure an expansion in their already
dominant global market share for services.
Medium-term Developments in Aggregate Agricultural
Trade
Even more disturbing long-term trends emerge from the WTO report in the
case of global agricultural trade. First of all, even as agricultural
trade remains very important for many countries, the share of agricultural
trade in world trade has decreased steadily in the longer term. Secondly,
processed agricultural products have been a more dynamic component of
international agricultural trade in the 1990s than unprocessed and semi-processed
goods.
There are several inter-related aspects of agricultural trade which are
brought out in the report. Most significantly, the significance of trade
in the agricultural sector has increased tremendously across the globe.
The volume growth of world agricultural trade during 1990-2002 was close
to 4 per cent annually, which was roughly twice that of agricultural production.
Real trade growth in agriculture during 1990-2002 in fact exceeded that
over the 1973-1990 period (2.4 per cent). It is clear that this points
to the increasing role of trade in agricultural sector at the global level.
However, despite this faster growth when compared to the earlier period,
since growth in agricultural trade was less strong than total merchandise
trade in nominal terms between 1990 and 2002, its share in total merchandise
trade has decreased from 29 per cent in 1963 to as low as 9.3 per cent
in 2002 [6]. The steadily
declining share of agricultural products in merchandise exports in the
1990s could be observed in most regions. The share of agricultural products
in intra-developing country trade also decreased from 15.5 per cent in
1990 to 10.7 per cent in 2002. Thus, even as the importance of trade in
the agricultural sector has increased and agricultural trade remains very
important for many countries, the share of agricultural trade in world
trade has decreased steadily in the longer term.
While the report does not offer any explanation for these seemingly conflicting
trends, clearly, the erosion of agriculture products' share in total merchandise
trade when agricultural trade was expanding in real terms reflects the
steady terms-of-trade decline experienced by agricultural commodities
over the last several decades[7]. The impact
of this has been the most severe for those countries which are dominant
suppliers of these products globally.
But, even so, agricultural products remain, for many countries, the mainstay
of their merchandise exports. In recent years (1999-2001), agricultural
exports accounted for more than one quarter of total merchandise exports
in more than 55 countries (developed and developing) and still exceeded
one half of total merchandise exports for 32 countries.
There were no significant changes in the regional shares of global agricultural
trade during 1990-2002. While Western Europe's and North America's share
in world exports of agricultural products each recorded a decline of two
to three percentage points, the combined share of Australia and New Zealand
at 4.5 per cent in 2002, remained unchanged compared to 1990. For the
developing countries as a group, the share amounted to 30 per cent in
2002 compared to 27 per cent in 1990. However, this increase in the share
of developing countries was mainly restricted to the Latin American and
transition economies, which increased their share by about two percentage
points between 1990 and 2002. Developing Asia recorded only marginal gains
over the entire period, whereas the share of Africa declined slightly.
Also, the increase seen in the share of developing countries could be
just due to the impact of the recovery in agricultural commodity prices
in 2003 from the decline since 1995, which may have led to slight improvements
in the shares of some of the agricultural exporting developing and low
income countries. But, this could not be ascertained from the information
available in the current report. Accounting for about 70%, developed countries
dominated global agricultural trade in 2002.
However, the report does point out that the share of intra-developing
country trade in developing country agricultural exports has increased
significantly from 31 per cent in 1990 to as much as 43 per cent in 2002.
At the same time, interestingly, the share of intra-developing country
trade in developing country imports of agricultural products was even
larger than that in the case of exports. In 2002, nearly one half (47.6%)
of developing country agricultural imports originated from other developing
countries.
These trends inevitably lead us to conclude that for developing country
agricultural exports, the developed country markets have clearly become
less accessible than those in developing countries, despite the fact that
WTO negotiations have been bringing about tariff liberalisation in agricultural
trade. But, simultaneously, the fact that there has been a steady rise
in the commercialisation of agricultural production globally, dominated
by transnational agribusiness firms, could also be behind this rapid rise
in intra-developing country agricultural trade.
It has been observed that the concentration in the international food
processing and food manufacturing industries has increased tremendously
over time and that these industries have moved from being more or less
competitive, to being oligopolistic or monopolistic in nature. Companies
which were engaged in one stage of the food system have either diversified
into other stages of the food system or have forged strategic allegiances
through mergers, partnerships and acquisitions. For instance, companies
such as Cargill, Monsanto in foodgrains and Tyson Foods in livestock not
only grow crops and rear livestock, but also process and manufacture food
products which they finally sell to the retailers. By integrating all
the stages of the food system, such companies have come to own the products
from the farm to the shelf [8].These changes
in the way agricultural production and trade are organised around the
world could also be the underlying factor behind the other major structural
change in agricultural trade highlighted by the WTO report.
Structural Shifts in Global Agricultural Trade
When agricultural trade between 1990 and 2002 was analysed by their stage
of processing (or value-added content), it was found that exports of processed
agricultural products expanded significantly faster than those of semi-processed
and unprocessed agricultural products. The share of processed products
showed a clear upward trend throughout the 1990s, rising from 42 per cent
in 1990-91 to 48 per cent of global agricultural trade in 2001-02.
The data revealed that trade in beverages (which are considered 100 per
cent processed) recorded an above average expansion in the 1990-2002 period
(4.8 per cent annually), while natural fibres and hides and skins (which
are considered 100 per cent unprocessed) recorded an absolute decrease
or near stagnation in the observed period. In eight other categories (with
the potential to move from unprocessed and semi-processed to processed
goods), there was a marked shift to more processed goods within the group
(cereals and products, coffee, tea, cocoa and spices, fish, other foodstuff,
meat and live animals, other agricultural goods (including cut flowers),
tobacco and sugar and sugar products. A moderate decrease or stable share
of processed goods was observed for the remaining categories (dairy products,
eggs, fruits, vegetables and nuts and oilseeds, cakes and vegetable oil).
The report reveals that about three quarters of the countries for which
data was available in the UN Comtrade database recorded an increase in
the share of processed goods in their agricultural trade between 1990-91
and 2001-02. In fact, there was a marked increase in the share of processed
products in total agricultural exports for the 14 major global exporters,
with the exception of two Latin American countries (Brazil and Chile).
The largest shifts to more processed agricultural products could be observed
in Asian developing countries (China, Indonesia, Malaysia and Thailand,
with gains in shares of processed over unprocessed agricultural exports
of 14, 17, 28 and 11 percentage points respectively). Marked increases
could also be observed for Canada and Mexico. Agricultural exports of
developing countries to high-income markets also experienced this structural
change.
Based on this, the report summarises that there has been a broad-based
shift across countries towards processed agricultural products, which
have been a more dynamic component of international agricultural trade
in the 1990s than unprocessed and semi-processed goods. The conclusion
appears to be that most countries have and would benefit from this structural
shift. However, the real picture may be more complicated than what the
report appears to suggest.
Based on trends in two lower income countries, Bolivia and Peru, which
have a higher share of processed goods in their agricultural exports than
New Zealand, the report suggests that there is no strong overall link
in the sample between income levels and the share of processed agricultural
products. But, it then contradicts this by adding that in general all
countries with a very low share of processed goods in their agricultural
exports (15 per cent or less) are indeed low or low middle-income countries
(e.g. Cameroon, Ethiopia, Honduras, Pakistan, Sri Lanka, Uganda and Zimbabwe).
On the contrary, one of the major implications of the fact that processed
goods have become the more dynamic category of agricultural trade would
be its impact on the trade expansion capacity of developing and low income
agricultural commodity exporting countries. Based on the singular example
of Chile which managed to expand agricultural trade between 1990-2001
across all product categories and stages of processing, the WTO report
claims that the above structural shift does not imply that individual
countries cannot achieve high export growth in unprocessed and semi-processed
goods. Chile's outstanding export expansion in agricultural products would
clearly need a deeper investigation to understand in particular whether
it was related to any free trade agreements in operation.
But, as the report itself points out in the concluding paragraph, with
respect to agricultural exports of low-income countries, no shift towards
an increased share of processed goods could be observed in any of the
three major higher income markets. Thus, there seems to be an attempt
to underplay the possible unfavourable outcomes that this structural shift
in agricultural trade may bring about.
According to the WTO report, the two factors that favour the expansion
of processed goods over unprocessed goods are the following. First, processed
goods have a larger potential for intra-industry trade and offer more
possibilities for product differentiation than unprocessed goods. The
example offered is that cocoa-producing countries will not see much bilateral
trade in cocoa beans, for example, while chocolate-bar/snack producing
countries can exchange their products, satisfying a broad variety of different
tastes. As per capita income levels increase, consumers appreciate a larger
variety of similar products and increasingly buy goods with a brand label.
Secondly, the potential to increase value added for a given consumer food
product is, in general, far larger than for unprocessed foods and this
underlies the shift to increased trade in processed foods. Also, the trend
to smaller household size and an increase in participation by women in
the labour force strengthens consumption trends towards more processed
food at the expense of unprocessed food. In fact, this is confirmed by
the trend on the import side, which showed an even more striking increase
towards a higher share of processed goods. Among the 38 major agricultural
importers, only eight recorded a decrease in the share of processed goods
[9].
It is evident that with processed goods becoming the more dynamic segment
within agricultural trade globally, for the middle and low income agricultural
exporters to expand their export revenues from agricultural trade, they
would have to first of all participate in this dynamism. However, the
value addition and product differentiation required for being successful
exporters in the processed segment calls for production process capabilities,
which the report appears to take for granted, but which are largely beyond
the reach of the indigenous farming communities in such countries. This
implies that manufacturing sector capabilities will strongly dominate
the prospects of developing and less developed countries' ability to increase
their shares in global agricultural trade.
Ironically, the logic offered for advocating tariff escalation to developing
countries is that progressively higher tariffs on higher stages of processing
than for agricultural commodities will promote their shift to higher value
added agricultural products. However, by being forced to undertake rapid
tariff liberalisation of their lower-end primary products, these countries'
very base for generating the surplus revenues required for investment
in higher value-added processing segments is getting eroded. Many low
income countries are being pushed into cutting their agricultural input
subsidies, promote commercial export-oriented agricultural production,
and reduce their agricultural tariffs all at the same time, as conditions
for multilateral loans. These policy prescriptions, for instance, find
their place in the so-called country papers, or the Poverty Reduction
Strategy Papers (PRSPs).
That is, while developed country agricultural exporters enjoy high subsidies,
their developing country partners are being forced to reduce subsidies.
Further, even as the tariff reduction imposed upon the developing and
less developed countries exposes their farmers to competition from the
highly subsidized farm production in the developed world, actual market
access provided by developed countries for developing country agricultural
exports remain immensely low, because of the high tariffs and quotas and
the prevalence of domestic support and export subsidies given by the EU
and the US. Thus, the ability of low and middle-income agricultural producers
to upgrade themselves to break into the global markets dominated by the
increasingly integrated production and trading networks of transnational
agribusiness firms on their own is highly limited.
Therefore, proliferation of agricultural trade which pushes commercialised
agricultural production on the one hand and refuse meaningful market access
on the other hand is happening at one level. Thus, most of the benefits
of the dynamism in trade in processed agricultural products will be appropriated
by the MNC firms involved in the global agri-food value chain. At another
level, there is increasing food import dependence because of agricultural
trade liberalisation by developing countries. These simultaneous processes
will lead to the break-down of the self-sustaining agricultural production
systems that have been the traditional backbone of middle and low income
countries' farming communities.
This will have severe human development implications, food security being
central to them. The fact that the rise in commercialisation of agricultural
activities is corresponding with a period of increasing global poverty
levels and decreasing per capita food consumption in several countries,
as has been highlighted by many agricultural economists, in fact portends
the impending development crisis facing the South.