John Stuart Mill was among the foremost liberal thinkers of modern times who wrote extensively…
Factory workers in India C. P. Chandrasekhar and Jayati Ghosh
Recent data from the Annual Survey of Industries, covering up to 2015-16, provide some interesting insights into the changing nature of industrial employment in India. In the decade up to 2015-16, there was a significant increase in the number of factory workers, by around 40 per cent. This expansion can be dated from around 2005-06 onwards and especially up to 2011-12. This is to be expected, given that that was the period of India’s economic boom, in which both construction and manufacturing industry showed higher rates of investment and output growth.
While the aggregate numbers still remain low for an economy of India’s size and ambitions, such an increase in doubtless to be welcomed. Figure 1 indicates the annual pattern of aggregate employment of workers and other salaried employees in the factory sector. There is no doubt that there is a trend change in the number of workers after 2005-06, while the increase in the number of salaried employees has been more muted.
Figure 1
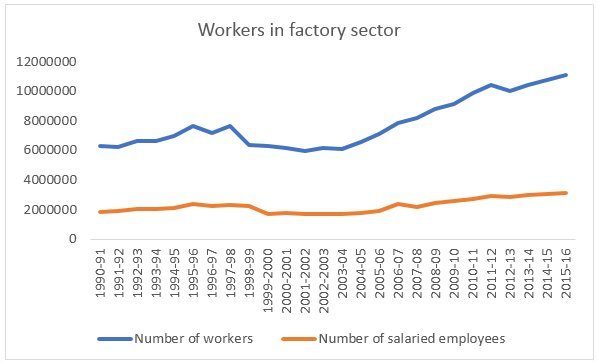
Source for all figures: Annual Survey of Industries, Summary Results for the Factory Sector, 2015-16
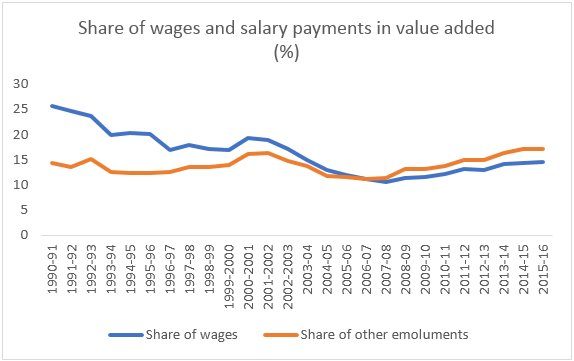
However, it is clearly the case that, despite such increases in employment, wages of workers have not kept pace with productivity increases in the factory sector. This is evident from Figure 2, which shows a significant medium-term decline in the share of wages to (net) value added, from 25.6 per cent in 1990-91 to as low as 10.6 per cent in 2007-08. This would have been one of the lowest such ratios among both emerging markets and advanced economies. The subsequent slight recovery in recent years, to values of just above 14 per cent, still point to a very substantial decline in wage share compared to the 1990s.
This decline in wage share is similar to – albeit significantly sharper than – the decline experienced in most other countries in the era of globalisation. But the Indian case is one of declines from an already relatively low base, which makes it all the more critical.
However, the more startling evidence may be that of the change in the share of salary emoluments in value added, also shown in Figure 2. While the number of salaried employees (rather than production workers) increased at a much slower pace, their share of value added has not declined as much over the entire period. Indeed, by 2007-08, their share exceeded that of workers, and thereafter kept increasing so that the gap between them also grew. As a result, in 2015-16, the numbers of salaried employees was less than one-third the number of workers, yet their share in value added was around 3 percentage points higher.
Figure 2.
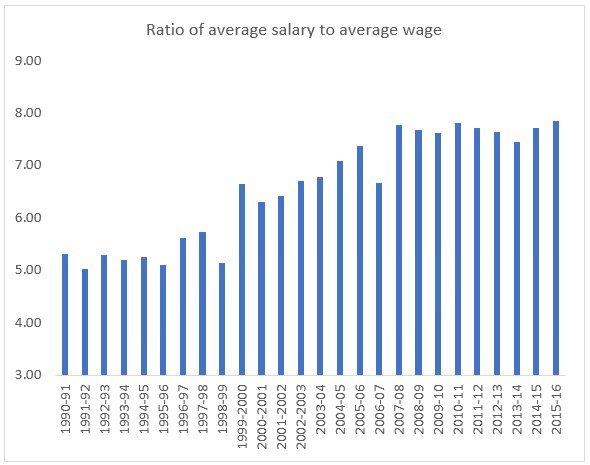
This is reflected in the relative average incomes of workers and salaried employees, expressed in Figure 3. This shows that the ratio of the average salary to the average wage increased manifold over this period, from slightly more than five times in 1990-91 to nearly eight times in 2015-16.
Such a result also confirms the evidence from other sources like the Trade in Value (TiVA) Added database and the World Input Output Database (WIOD), which point to the falling shares of the “fabrication” or pure production component in value added and the rising shares of various pre-production and post-production stages like design and marketing, which both increase the returns to intellectual property in various forms, and also disproportionately reward certain types o skilled and professional employees. Such a tendency is marked in most countries for which the data are available – with the honourable exception of China, which has experienced increases in both the fabrication component and the share of workers’ wages in value added.
But the Indian experience is once again an extreme example of the overall trend, indicating greater dispersion of remuneration within the factory sector and therefore greater inequality between workers and other salaried employees.
Figure 3.
Of course, this is only one possible reason for the somewhat surprising trend. Another could well be related to organisational changes in the workforce – particularly the increase in contract workers with fewer rights and much lower bargaining power than regular permanent workers.
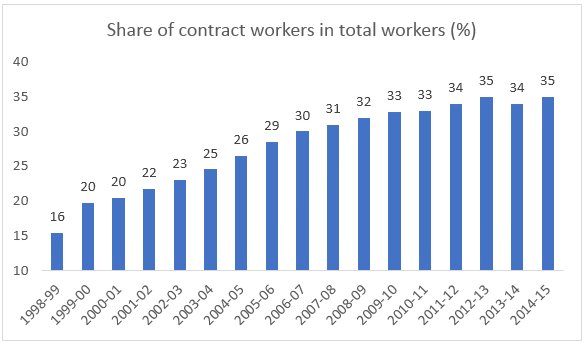
For some reason, the latest release of data for ASI 2015-16 does not contain evidence on the number of contract workers, unlike previous versions of the annual survey. However, the overall trend can be gleaned from the past reports, and these show a sharp and disturbing increase in the number of contract workers and their share in the total workforce. Indeed, as Figure 4 suggests, the increase in share has been dramatic over a relatively short period – more than doubling from only 16 per cent of all factory workers in 1998-99 to as much as 35 per cent in 2014-15.
It is unlikely that this ratio would have changed much in the latest year, 2015-16. So it can safely be assumed that at least around one-third (and possibly more) of the workers in the factory sector are hired on contract with few rights and close to non-existent bargaining power. For obvious reasons, this would act as a drag not only on their own ability to demand higher wages, but also on the ability of the more permanent workers to do so as well.
Figure 4.
Therefore, while numbers of workers in factory employment may have increased somewhat in the recent past, it is likely that those employed would nevertheless be facing fragile and insecure conditions of work with low bargaining power.
(This article was originally published in the Business Line on August 13, 2018)