Sri Lanka defaulted on its external debt for the first time in its postcolonial history…
Why aggregate employment in India is shrinking? Anamitra Roychowdhury
The jobs crisis prominently visible among rural females earlier has now spread to the rural male segment
Question of livelihoods and the lived reality of people, sooner or later, catch up with any democratically elected government. One of the major promises on which 2014 elections were won was massive job creation (https://economictimes.indiatimes.com/news/politics-and-nation/one-crore-jobs-if-bjp-comes-to-power-narendra-modi/articleshow/26165012.cms?from=mdr). Even after its stunning victory in 2019, primarily fought on the national security plank, among the first things the Modi government did was to set up a cabinet committee to create jobs (https://www.livemint.com/politics/policy/government-sets-the-ball-rolling-to-create-more-jobs-and-attract-investments-1559760034591.html). Clearly, sensitivity of the livelihoods issue is recognized and likely to be taken up by the opposition in coming days, with the potential of quickly altering opinions. In fact, there was wide speculation after the resignation of the chairman of the National Statistical Commission that the employment data, showing highest unemployment rate in 45 years, was willfully suppressed. Finally, the Periodic Labour Force Survey (PLFS) data was made public on 31 May 2019. What does it show?
Source: PFLS 2017-18
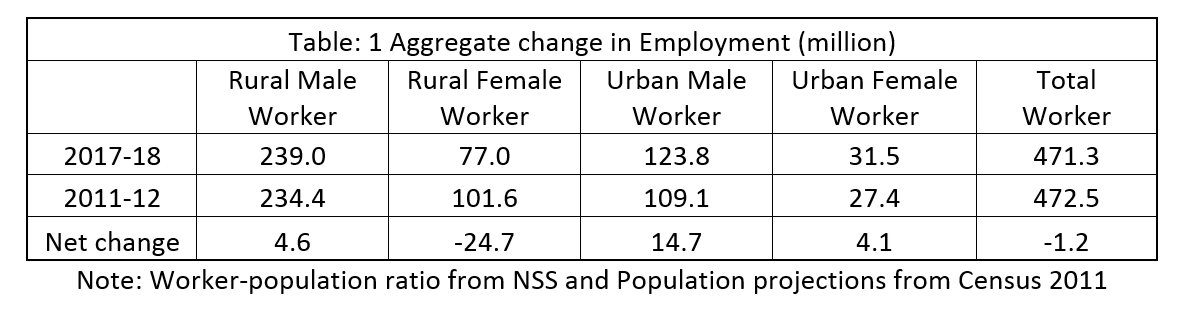
Preliminary analysis of PLFS data shows that the most striking news – for the first time in 45 years, ever since NSS surveys were conducted – is contraction of aggregate employment by 1.2 million between 2011-12 and 2017-18 (Table 1). Aggregate employment, which stood at 472.5 million in 2011-12, came down to 471.3 million in 2017-18. This is primarily driven by rural females losing 24.7 million jobs; other segments of the workforce saw net addition to jobs.
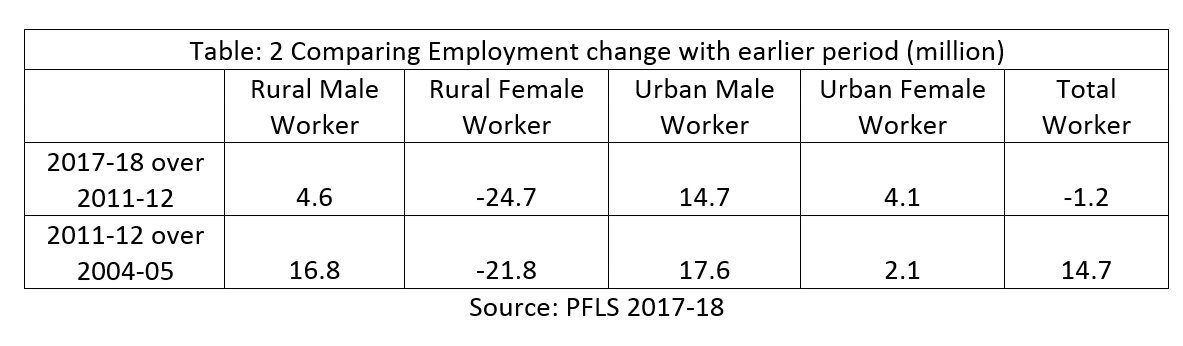
To be sure, decline in rural female workforce is not something new – this is happening for quite some time now. Note that in the earlier period, between 2004-05 and 2011-12, female workforce in rural area shrank – although the magnitude of fall was less than in the current period – by 21.8 million (Table 2). The other big takeaway from PLFS data is the close to fourfold slowdown in employment creation for rural males. Thus, the jobs crisis prominently visible in the previous period in rural female segment seem to have spread to the rural male segment now – as employment in the later segment merely increased by 4.6 million in the current period, compared to 16.8 million in the previous one – engulfing the whole rural economy. Hence, much more is needed than simple cash transfer schemes or increasing MSPs periodically and debt reliefs. Public investment in agriculture along with energizing MGNREGS (to help create rural infrastructure), among others, should be on the cards.
Moreover, pace of employment expansion for urban males also decelerated in the recent period (14.7 million) compared to the previous one (17.6 million); it is only in the urban female segment that employment growth picked up registering 4.1 million increase compared to 2.1 million in the previous period.
 There is another way of looking at the employment debacle. It is to look at the sectoral distribution of employment. With majority of rural persons still engaged in agriculture, a crisis in the rural economy most prominently manifests itself in agricultural employment. Note that people in large numbers (27.1 million) deserted agriculture between 2011-12 and 2017-18, once again led by rural female workers (19.8 million) (Table 3). This decline in agricultural employment is visible across every segment of the workforce, except urban males. Therefore, the much discussed unremunerative returns from agriculture are confirmed by the latest data. People are seen to be leaving agriculture, primarily due to push factors, for there was inadequate absorption in non-agricultural sectors of the economy (25.9 million). Precisely, due to this reason i.e., more people abandoning agriculture than the available non-agricultural jobs that aggregate employment turned negative.
Table 3 also shows the failure of Make in India programme and futility of enormous money spent on imparting skills, as these were primarily targeted at boosting manufacturing employment. Overall manufacturing employment growth turned negative (0.9 million) and benefits of Skill-India programme seem to have bypassed every section of the workforce, except urban males. Thus, a comprehensive well-calibrated manufacturing policy focusing on the labour-intensive sectors seems to be the need of the hour. Further, note that construction sector widely viewed as the employer of last resort in the previous period barely managed to absorb 4.6 million new workers in the current period. How does this compare with the previous period?
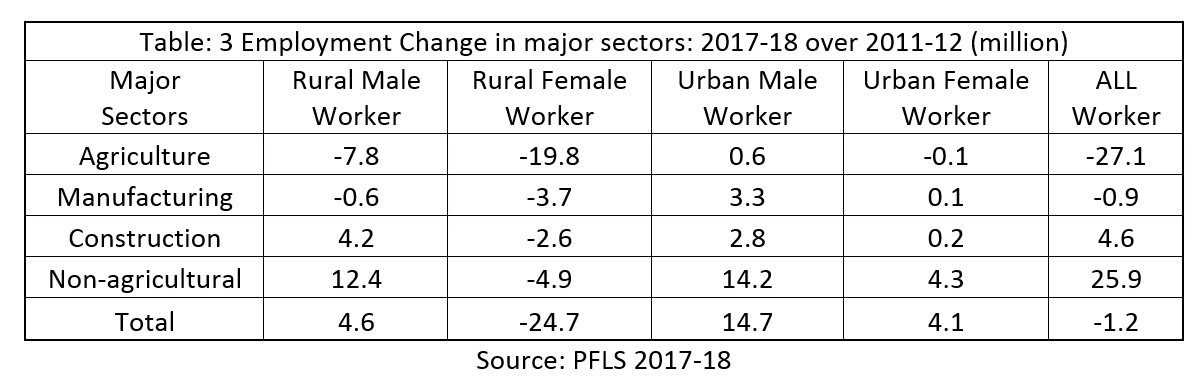
Table 4 compares the capacity of labour absorption in key sectors of the economy over two periods. Note that between 2004-05 and 2011-12, construction sector added 24 million jobs becoming the largest sector of the economy in terms of job creation. Thus, compared to the previous period there is more than fivefold deceleration in job growth in the construction sector. Further, note that manufacturing sector absorbed 5.3 million workers in the earlier period, which posted negative growth in the present period mentioned above.
The alarming situation in aggregate labour market can also be comprehended from the slowdown in non-agricultural job growth. Notice from Table 4, larger number of people moved out of agriculture (34.4 million) between 2004-05 and 2011-12, compared to the recent period (27.1 million) i.e., 2011-12 and 2017-18. However, aggregate employment still expanded by 14.6 million in the previous period, while in the present period we already noted that employment shrunk by 1.2 million. This is simply because labour absorption in non-agriculture almost halved in the current period; while employment in non-agriculture expanded by 48.9 million in the previous period, presently it could only absorb 25.9 million fresh workers. Thus, there is an urgent necessity to revive non-agricultural employment alongside supporting agriculture.
Finally, on the issue of comparability of PLFS with earlier NSS rounds. First, the chairman of National Statistical Commission, who resigned, categorically mentioned: ‘When we [National Statistical Commission] approve a report, I am not going to give a figure which is not comparable with the other ones. Second, the concept of employment and unemployment are universally accepted. International Labour Organization prescribes the standards, we all follow it.’ (https://scroll.in/latest/912803/unemployment-former-statistical-commission-chief-denies-centres-claim-that-report-is-a-draft). Second, Professor R. Ramakumar pointed out that the sampling design only changed at a later stage (second stage stratification) and there are inbuilt mechanisms to correct over/under representation of any group (https://www.newsclick.in/unemployment-india-NSSO-PLFS-Amitabh-Kant-Surjit-Bhalla). Finally, by saying underemployment rates are not comparable with earlier rounds due to educational factors, it is implicitly argued that those looking for jobs but unable to find it are voluntarily unemployed. It is a cruel joke on those unable to find work, given the employment situation described above, when traditional sectors of the economy are shedding/inadequately absorbing labour and modern sectors are incapable of accommodating them (including the educated). Instead of denying the jobs crisis, it should be tackled head on, for any government neglecting these facts does so at its own peril.
(This article was originally published in The wire on July 15, 2019)