Sri Lanka defaulted on its external debt for the first time in its postcolonial history…
Where are the Jobs for the Girls? C. P. Chadrasekhar and Jayati Ghosh
It is now well known that the Periodic Labour Force Survey of 2017-18 of the NSSO (the release of which was originally suppressed by the government) revealed a dramatic fall in absolute employment of both men and women, and a further decline in women’s work force participation rates from their already very low levels. There are clearly important questions to ask about a macroeconomic trajectory that can generate such employment outcomes even as GDP appears to have increased reasonably rapidly. But the issue of women’s employment provides a particular conundrum, since it flies in the face of both received wisdom and the experience of other developing economies that have grown rapidly.
In the absence of accepted population projections for 2017-18, it is hard to estimate the absolute changes in women’s employment. But the work participation rates described by the survey show a stark patter of decline—for both men and women, as Figure 1 indicates.
Figure 1: Both male and female employment rates declined recently
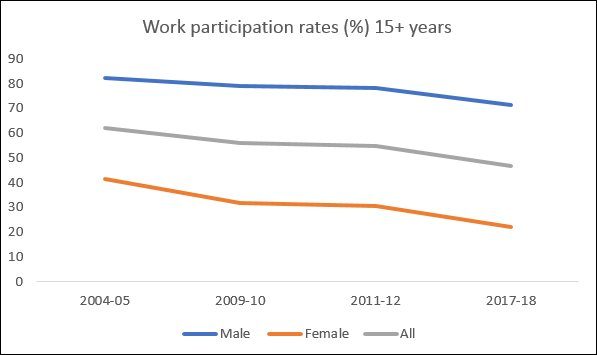
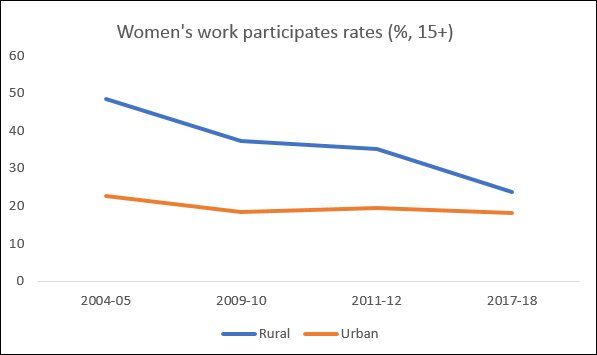
Figure 2 shows how the decline was particularly steep for rural women. This continues a pattern of decline that began effectively from the early 1990s but has turned steeper since the mid-2000s. Indeed, the most recent fall appears to have been so sharp that urban and rural rates of women’s work participation, which were earlier significantly different, are now very similar. For young women in the age group 15-29 years, the rural employment rate is now down to only 13.8 per cent, only marginally higher than the urban rate of 12.8 per cent. While some of this can be attributed to more engagement of young women in education, this is not adequate to explain the decline. It is likely that life cycle changes like marriage and childbearing also play a role in reducing young women’s labour force participation, which has also fallen.
Figure 2: The sharpest decline in work participation was for rural women
Meanwhile, other data from the survey point to the disturbing finding that the more educated young women are the least likely to be employed and more likely to be openly unemployed, such that the unemployment rate for young women in urban areas was 27.2 per cent in 2017-18, and for young urban post-graduate women it went up to as high as 37.2 per cent! So education does not seem to be the way out of the employment morass – for many young women, it may simply be postponing the problem.
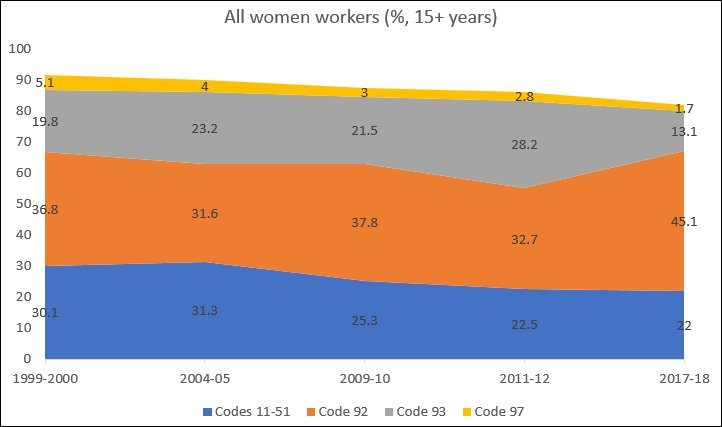
When the decline in women’s work participation was noted after the 2011-12 NSSO survey, there were some attempts to explain it in terms of the shift to more women engaging in unpaid work, because of the increase in women classified under Code 92 (engaged in domestic duties – essentially care work within the household) and especially Code 93 (domestic duties plus extended SNA activities like fetching fuelwood, fetching water, engaging in kitchen gardening and livestock and poultry rearing, etc.) However, another surprising result from the PLFS 2017-18 is the decline in the proportion of women in Code 93, as shown in Figure 3.
This is clearly something that deserves much deeper investigation. At one level, this may be a welcome sign that there has been an improvement in the provision of basic infrastructure and amenities, such that fetching fuelwood and water do not require as much of women’s time as before and therefore do not condemn them to this form of unpaid work. However, it could also be a misclassification by investigators (as suggested by the corresponding increase in Code 92) – or even be a result of more education, as suggested by the increase in open unemployment of women in both rural and urban areas.
Figure 3: Even the proportion of women engaged in unpaid work seem to have declined!
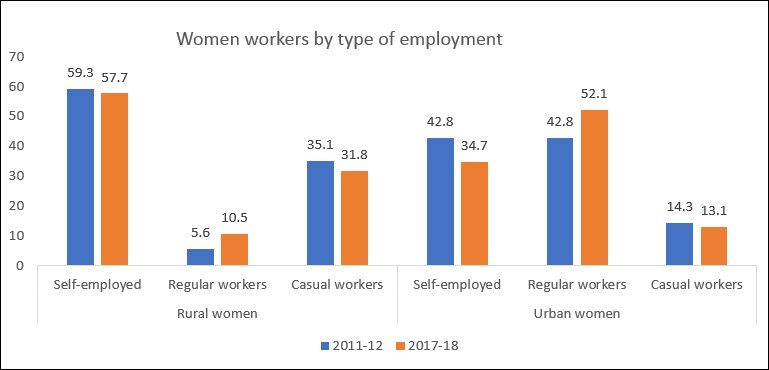
One result from the PLFS that has been greatly welcomed by observers is the increase in the share of regular and/or salaried work of women (Figure 4). This would certainly be a positive move if it occurred in the context of a dynamic labour market with increasing employment opportunities. However, overall work participation rates of women have fallen sharply, so the share of women of age 15 years or more who are in regular employment of any kind has barely changed – it has increased marginally from 1.97 per cent to 2.04 per cent in rural areas and fallen slightly from 10.14 per cent to 9.48 per cent in urban areas. This suggests that there has been barely any increase in the absolute numbers of women in regular employment.
Figure 4: Regular work has increased as share of women workers,
but not as share of all women of 15 years and more
All of this points to extreme slackness in the Indian labour market, with a massive and growing paucity of adequate employment opportunities. The world over, in such conditions, women workers tend to get rationed out of the better jobs, and when there are few jobs to be had, they get excluded from most forms of paid work. Something similar seems to be happening in India.
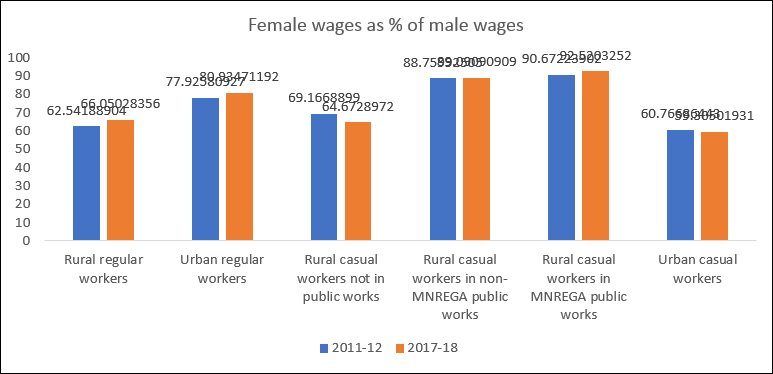
How has this played out in terms of gender wage gaps? Figure 5 suggests that the ratio of wages of women regular workers to that of male regular workers has increased very slightly, in both rural and urban areas. However, in private casual work, gender wage gaps have increased. The only saving grace is in rural public works, and especially in MNREGA works, where the gender wage gap for casual work has further narrowed and is significantly lower than in other activities.
Figure 5: Gender wage gaps have declined slightly for regular work
but increased for private casual work
It is clear that women and especially young women are the worst casualties of the employment crisis in India at present. The evidence also suggests that public employment has a critical role to play if more women are to find gainful employment with better conditions of work.
(This article was originally published in the Business Line on February 25, 2020)