John Stuart Mill was among the foremost liberal thinkers of modern times who wrote extensively…
Misleading Picture of Household Wealth C. P. Chandrasekhar and Jayati Ghosh
In recent years, when the economy as a whole performed poorly, reports on how old and new businesspersons accumulated huge volumes of wealth in short timespans have been commonplace. There is also evidence that conspicuous consumption is on the rise. This has led observers to conclude that income and wealth inequality in India has increased. Hard evidence on the extent of that increase is difficult to come by. One reason is that official surveys of trends in income in different income classes are not available. Using consumption surveys and treating consumption expenditure as a proxy for income does not help. Surveys of consumption expenditure and its distribution inadequately capture the gains registered by high-saving upper income group households and individuals and, therefore, fail to accurately reflect trends in inequality. Moreover, these surveys are known to significantly underestimate consumption in the upper percentiles of the distribution.
Unlike in the case of income, we do have direct surveys of asset holdings by households, conducted as part of the periodic All India Debt and Investment Surveys (AIDIS) which, in principle, should help assess trends in the levels and distribution of wealth at the household level. However, these too have many shortcomings. The information is based on asset holding as reported by those canvassed, which could lead to underreporting, especially in the case of the richer households that may not have reported the incomes used to acquire assets. The methods of attaching a value to the assets identified are not always robust. The coverage and valuation of holdings of financial assets are unreliable. And, given the difficulties of valuing household durable assets, including bullion, which is a major form of wealth holding among the middle- and upper-income groups, they have in recent rounds been left out of the survey. All this would, as in the case of the consumption expenditure surveys, result in considerable underestimation of wealth holding, and much more so in the highest asset holding classes.
The two most recent of the debt and investment surveys were conducted in 2013 and 2019 (70th and 77th Rounds of the National Sample Survey), with June 30th of the previous year as reference date. In principle, this allows for assessing what happened to wealth inequality in the years prior to the pandemic. But the results of those surveys, especially the one conducted in 2019, are so out of sync with other qualitative and quantitative evidence that their reliability and, therefore, usefulness, are in question.
The first such result is that, according to this data, asset inequality in India declined significantly in mid- 2018 when compared with middle of 2012, especially in urban areas. The ratio of the value of assets held by the “wealthiest” decile, or the top 10 per cent of households, relative to that held by the bottom 40 per cent, fell from 11.5 to 8.6 per cent in the case of rural households and from 48.2 to 27.7 per cent in the case of urban households (Chart 1). While the evidence that asset inequality in rural areas is lower than in urban areas is in keeping with other evidence, the picture of a decline in asset inequality in recent years, especially in urban areas, is definitely not.

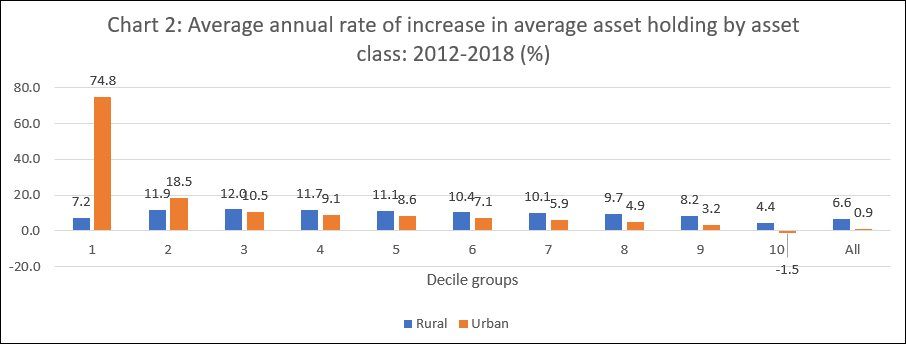
A second counterintuitive tendency reflected in a comparison of the 2013 and 2019 surveys is that rural-urban asset inequality declined significantly in this short period. If we examine the average annual increase in the average value of assets (deflated using the wholesale price index) held in different decile groups and overall over 2012-2018 (Chart 2), we find the following. Asset value growth was apparently higher in the lower decile groups of households in both rural and urban areas, and in most groups, asset holding rose to a greater extent in rural than in urban areas. Across rural households, the ‘real’ value of asset holding rose by 6.6 per cent per year on average, compared to just 0.9 per cent in urban areas. As a result, the ratio of the average asset holding across households surveyed in urban areas to those in rural areas is reported to have declined from 2.3 in June 2012 to 1.7 in June 2018.
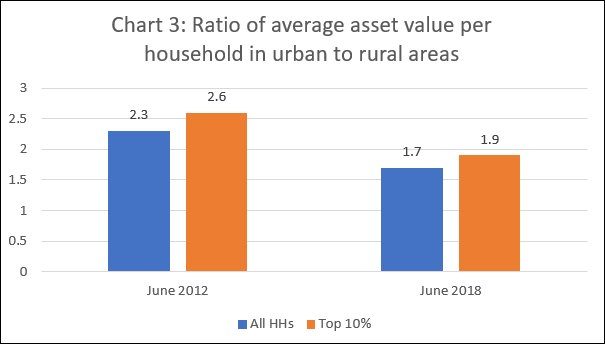
The data also suggest that the extent of rural-urban inequality in asset holding among the richest 10 per cent of households was not very different from that among all households surveyed, and that the urban-rural asset holding ratio amongst the richer households also declined from 2.6 to 1.9 (Chart 3). Given the sharp rise in real estate prices in urban areas and in the prices of financial assets which are known to be disproportionately acquired by the urban rich, this does not seem plausible. For example, the value of the Bombay Stock Exchange index (Sensex) more than doubled between end June 2012 and end June 2018.
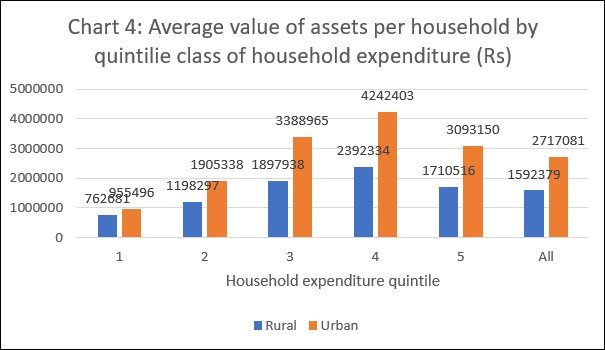
Finally, there are surprising variations in the average asset holding in household groups classified according to household expenditure. In 2018, the level of average household asset holding rises with household expenditure as expected, but only up to the fourth quintile. For the 20 per cent of households reporting the highest household expenditure in both rural and urban areas, asset holding was supposedly lower than in next lower quintile, and even lower than in the third quintile of households (Chart 4). This too is clearly implausible.
Did changes in methodology affected the comparability of the data in the two surveys? The report relating to the 77th Round says: “The concepts and definitions followed in the AIDIS of 77th Round and 70th Round are similar except for valuation of building. Values of land and building on the reference date were recorded in the 70th round as per their normative/guideline values, whereas in the 77th round values of building were recorded ‘as per the market price prevailing in the locality’.” Normative/guideline values are determined “in consultation with Patwaris (or equivalent) in the rural areas and the Registrar’s office in the urban areas”. One would expect that the prevailing market price would be higher than something like a ‘circle rate’ determined by a patwari or registrar’s office. Yet, surprisingly, in urban areas, though the nominal value of land held rose by 25 per cent between 2012 and 2018, the value of assets in the form of buildings fell by 0.6 per cent. Using market prices has resulted in a decline in the value of assets held in the form of buildings. That problem did not show up in the rural areas where the corresponding figures were 50.8 and 66.8 per cent.
All this suggests that these official data may not provide sufficiently reliable evidence to enable assessment of levels and trends in household wealth in a meaningful manner.
(This article was originally published in the Business Line on January 10, 2022)