The World Bank and the IMF Spring meetings begin this week in Washington. And with…
The Rupee’s Decline C. P. Chandrasekhar and Jayati Ghosh
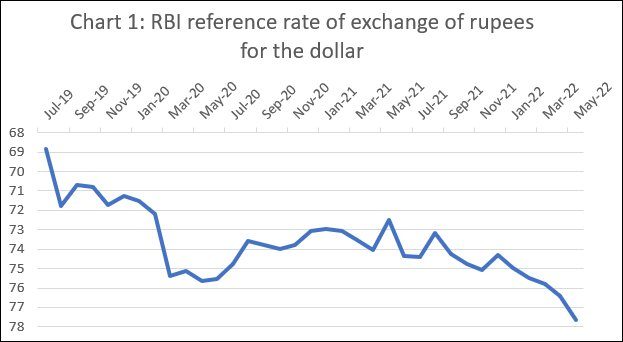
The second half of June saw the rupee’s value touching record lows below 78 to the US dollar. But this absolute low should not take away from the long term decline the rupee has been experiencing. If we consider the last three years, for example, the rupee slumped from Rs. 68.9 to the dollar at the end of July to Rs. 72 to the dollar by the end of August (Chart 1). That was before the COVID-19 pandemic. With the onset of the pandemic and the sudden stop in economic activity that accompanied it, the rupee slumped again from an average monthly value of 72.2 to the dollar in February 2020 to 75.4 in March that year. More recently, the rupee’s value has fallen from 75 to the dollar in January 2022 to Rs. 77.7 in May. Subsequent to each of these eiposdes of decline, the rupee remained in the neighbourhood of its new low, before experiencing a further fall.
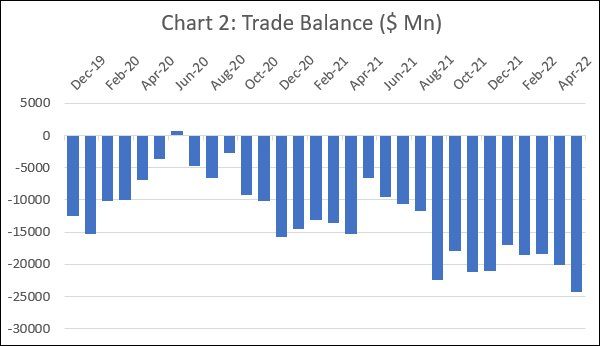
These declines in the rupee were, as is to be expected, influenced by multiple factors, with the importance of any one driver varying in each of the episodes of decline. Important among these drivers are weaknesses in the trade and current accounts of the balance of payments, expressed in a widening of deficits. In India’s case two important influences on the size of the trade deficit have been imports of oil and gold, especially the former. Interestingly however, of the three episodes of rupee depreciation during the last three years, the first two have not seen any pressure exerted by rising oil prices on the trade deficit. Thus, August 2019 was a month when the average of daily prices of the crude oil basket that India imports fell to $59.35 a barrel, from $63.63 in the previous month and $71 in April 2019. Similarly, oil prices fell to near historic lows when the COVID-19 pandemic first struck. It is only in recent months, corresponding to the third recent episode of depreciation, that oil prices have been rising.
When oil prices were subdued, although the trade balance was in deficit during the first two episodes of rupee decline, the maximum value of the deficit touched only around $15 billion a quarter (Chart 2). It is only more recently that the quarterly deposit figure rose to $25 billion, contributing significantly to the pressure on the rupee. This, even though India has benefited from purchases of oil from Russia at discounted prices after the invasion of Ukraine. Indian refineries obtained around 25 million barrels of Russian oil in May 2022, or more than 16 per cent of all their oil imports. Overall, as compared to one per cent of seaborne oil imports by India in 2021 and the first quarter of 2022, the share of imports from Russia touched 5 per cent in April 2022.
The common driver of rupee depreciation in all three episodes under consideration was outflows of capital from the country. The rupee’s value declined in August 2019 principally because of the exit of foreign portfolio investors, which resulted in a fall in net investments followed by an outflow of capital. In June 2019, net portfolio investment fell sharply, and then turned negative over the next two months. Subsequently, when net portfolio investment turned mildly positive in September, the rupee too stabilised and registered mild appreciation. Similarly, over the quarter ending March 2020, uncertainty created by the pandemic resulted in a net outflow of portfolio capital of $13.7 billion and a marginal inflow of 642 million in the next quarter. It was only subsequently, when developed country central banks eased monetary policy considerably, that inflows rose to $7 billion and $21.2 billion in the quarters ending September and December 2020.
Finally, in recent months, influenced by global uncertainty and expectations of inflation-induced increases in global and US interest rates, capital has again been flowing out of the country. During 2022, till June 16, the net outflow of debt and equity investments from Indian bond and equity markets amounted to $26.9 billion. Clearly, the accumulation of footloose foreign investments in India’s financial markets, leading to outflows in periods of uncertainty, seems to underlie the volatility in the rupee’s value in recent times.
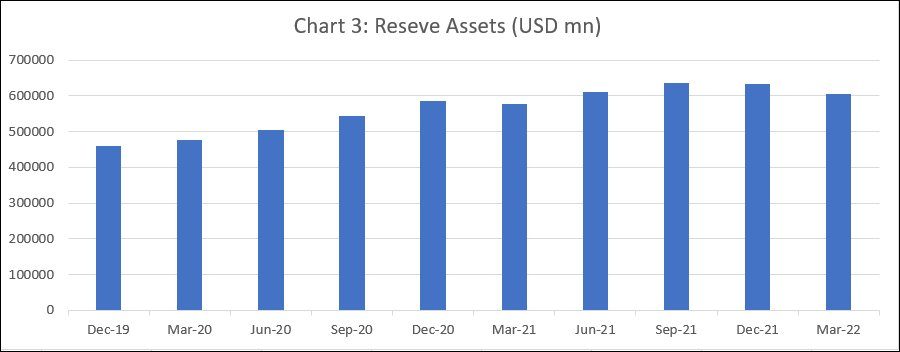
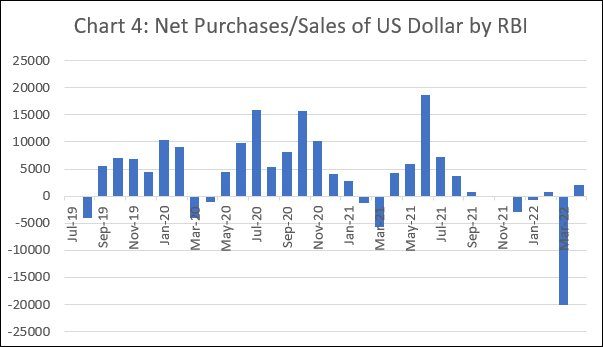
It would appear that this decline of the rupee could have been stalled through open market intervention by the RBI, given its large foreign exchange reserves. In fact, despite outflows of capital, foreign reserve assets with the central bank rose, rather than fall, in almost all quarters since the last quarter of 2019, with the exception of the two quarters ending March 2021 and March 2022 (Chart 3). Sale of foreign dollar assets would have helped strengthen the rupee and stall or limit the decline in its value vis-à-vis the dollar. However, there have been only a few months after January 2020, when the RBI was a net seller of dollars (Chart 4).
This could be interpreted as an effort on the part of the RBI to allow the rupee to depreciate to improve the competitiveness of India’s exports and render imports more expensive in rupee terms, thereby reducing the trade deficit. But as emerges from our discussion the trade account has remained weak despite long term depreciation of the rupee. In fact, during the recent round of depreciation, even though exports improved marginally, the import bill rose so sharply that the trade deficit widened significantly. Meanwhile, rupee depreciation adds to the inflationary pressures within the Indian economy.
(This article was originally published in the Business Line on June 27, 2022)