Sri Lanka defaulted on its external debt for the first time in its postcolonial history…
The Anatomy of Inflation C. P. Chandrasekhar and Jayati Ghosh
As news broke that the monsoon month August was the driest since 1901, when records began to be kept, fears of inflation gathered strength. At 161.7 mm across the country, rainfall that month was well below the previous record low of 191.2 mm recorded in 1905. This August’s 36 per cent deficiency in rainfall relative to normal comes after shortfalls of 9 and 13 per cent shortfalls in June and July. So, the projection is that the overall monsoon would be well below normal. That could imply that the level of agricultural, especially food grain, production, which has been reasonable or bountiful for the last seven years, may drop significantly in crop year 2023-24.
This prospect is a cause for concern since, in recent times, food prices have been rising even when both the harvest and stocks with the government have been comfortable. This history, combined with a sharp fall in domestic production and rising global prices, could trigger an inflationary spiral. This is not good news for the BJP, the party in government, having to face elections in less than a year’s time.
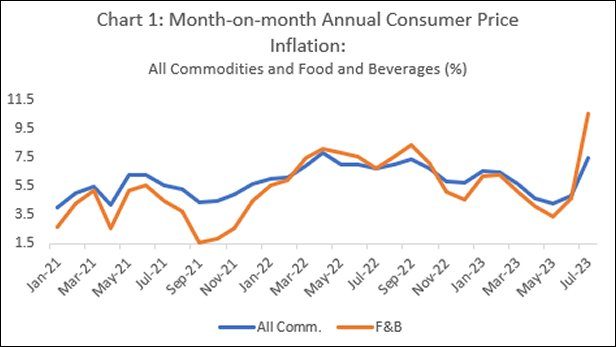
There are several noteworthy features of consumer price inflation in the period since the onset of the COVID pandemic. Over January 2021 to July 2023, rates of month-on-month inflation (relative to the corresponding month of the previous year), as reflected in the consumer price index (CPI) for All Commodities, closely followed movements in the CPI for Food and Beverages (F&B) alone (Chart 1). Food price inflation appears to have been the dominant driver of overall consumer prices inflation, with slight deviations from that tendency visible in the second half of 2021 and to a lesser extent in the second half of 2022 and first quarter of 2023. In both these periods, deviations of aggregate inflation from F&B inflation were largely on account of fuel prices (Chart 2). However, given the weights of F&B and Fuel and Light (F&L) in the overall CPI, inflation rates in the CPI for commodities excluding Fuel and Light were only slightly lower than those in the CPI for F&B and F&L (Chart 3). Significantly, food has been the principal driver of inflation, even through the years when foodgrain production has been satisfactory or good.
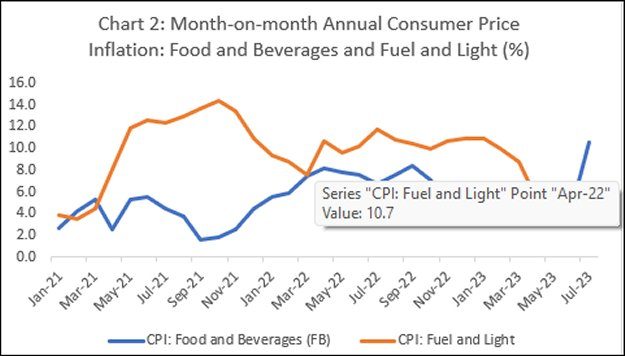
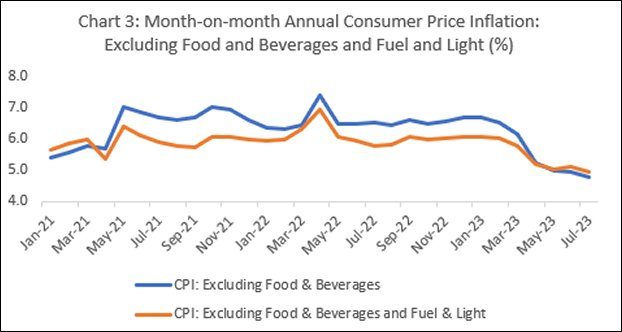
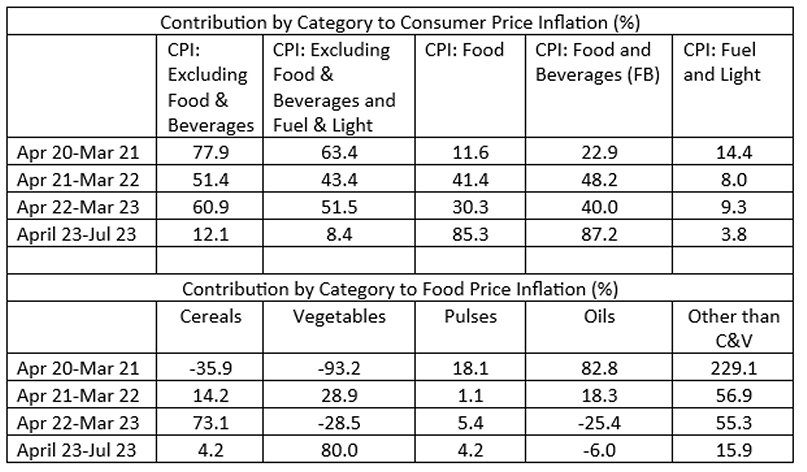
Table 1 examines the contribution of different commodity groups to overall consumer price inflation over different time periods, between April-March 2021 (when the monthly CPI rose by 5.4 per cent) to April-July 2023 (when it rose by 8.2 per cent). What is remarkable is the contribution of Food & Beverages to these increases, which rose from 23 per cent over 2020-21, to 87 per cent over April to July 2023.
By contrast, the contribution of Fuel and Light to the CPI over these periods fell from 14 per cent to 4 per cent. Despite the speculation-induced increases in global fuel prices after the Ukraine invasion, India was not hurt too badly because of access to oil through long-term contracts and at discounted prices from Russia.
As a result, food price inflation has dominated aggregate inflation. The contribution of commodities other than F&B and Fuel and Light to aggregate consumer price inflation fell from 78 per cent over 2020-21 to only 12 per cent over the four months ending July 2023.
Table 1: Inflation by component
This dominant role for food prices in driving inflation is striking because, as noted earlier, it has occurred in a period of comfortable levels of production. Domestic food grain production was around 300-310 million tonnes during the crop years 2019-20 to 2021-22, and is currently projected to be 331 million tonnes in 2022-23, well above target. Stocks of rice and wheat with the FCI and other government agencies stood at 57.6 million tonnes in early July 2023, as compared to the total buffer stock requirement of 41.1 million tonnes. So, supply shortfalls cannot explain inflation.
A further puzzle is the role of price changes in specific commodities within food and beverages. During 2020-21, possibly because of intervention by the government to distribute free foodgrains in response to the pandemic, the contribution of cereals and cereal products was a negative 36 per cent. This increased to a relatively low 14 per cent in the next year, but then spiked to 73 per cent in 2022-23. Over April-July 2023, cereals contributed only 4 per cent to food inflation, but from a very high level.
A plausible explanation is that, just as in global markets, food price inflation was triggered by the easy availability of credit following monetary policy adjustments during the pandemic. With the post pandemic revival of activity, and given the easy liquidity situation, speculative increases have made cereals an important driver of food price inflation.
As compared with cereals, the contribution of the prices of vegetables, which were badly hit by both depressed pandemic demand and disruption of the trade, was a negative 94 per cent over 2020-21 and 29 per cent over 2022-23 (interspersed with a positive contribution of 29 per cent in 2021-22). But more recently, sharp increases in the prices of tomatoes and onions have raised the contribution of vegetables to 80 per cent. While unseasonal rain and uneven distribution of rains has been blamed for the sharp spike in vegetable prices over short periods, a role for speculation even in the case of these perishables cannot be ruled out.
It is in the background of this increased role for speculation, that the potential impact of a significant fall in production in the coming agricultural year because of a bad monsoon has to be assessed. Though stocks with the government are at comfortable levels, the drop in production would fuel speculation. Given the growing heft in agricultural markets of agribusiness firms with deep pockets and policy influence, this could lead to explosive food price inflation. Given the dominant role of these commodities in recent consumer price trends, a period of higher inflation seems likely.
(This article was originally published in the Business Line on September 4, 2023)