Sri Lanka defaulted on its external debt for the first time in its postcolonial history…
Making Sense of the Latest Consumption Survey C. P. Chandrasekhar and Jayati Ghosh
For well over a decade, policy makers and citizens had little idea of the extent of income poverty or economic inequality in India, because of the absence of official survey data on consumption expenditure, which have formed the basis of such estimates in the past. The NSSO is supposed to conduct such surveys every five years, but the 2011-12 survey was the last for which any results were available until recently. The report of the survey conducted in 2017-18 was ready for release, but the Modi government decided to scrap it, probably because the results (apparently showing a decline in rural consumption) were not to their liking.
Another consumption survey was finally conducted in 2022-23, and obviously, the results have been eagerly awaited. Unfortunately, the NSSO changed its methodology for this survey, which means that it cannot be compared to earlier surveys (see https://thewire.in/economy/why-the-2023-consumption-survey-is-not-comparable-with-previous-rounds for details). This also means that we cannot calculate trends in consumption and distribution, and any attempt to do so would be fallacious and misleading. In the absence of more detailed data from the survey being released and a clear definition of the poverty line, we cannot even gauge the extent of poverty—despite the claims of some government spokespersons that the incidence of poverty is down to only 5 per cent.
Nevertheless, the “Factsheet” that has just been released before the general elections does provide some insight into the state of consumption and its distribution in the country. The first notable point is the large gap between per capita consumption as derived from the national accounts data, and what emerges from the actual household survey of consumption. Such a difference is not new, but it is greater than in the past. Figure 1 indicates that if we use the National Accounts Statistics data on private final consumption expenditure to calculate per capita consumption, the figure is as high as Rs 9896 per month. However, rural per capita consumption expenditure is around one-third of that, and urban around two-thirds.
There are two ways of addressing this discrepancy. A few economists determined to derive a favourable view argue that this means that the consumption survey data should be inflated accordingly, and across the board, which would obviously increase incomes of everyone. Others take a more balanced view, recognising that consumption surveys are well-known to underestimate the tails of the distribution, and particularly to underestimate the consumption of the rich and very rich, who rarely get questioned in such household surveys. Indeed, a monthly per capita consumption of Rs 20,824 among the top 5 per cent in urban areas may seem high, but it is clearly an underestimate given the extent of highly public and blatant conspicuous consumption especially in urban India at present. That, combined with the other problems of estimating GDP, means that as far as actual consumption is concerned, for most of those surveyed, the results are accurate, but the survey underestimates consumption of the rich, and therefore the extent of inequality.
Figure 1 also provides another number: the lowest minimum wage for unskilled government workers anywhere in the country, which could perhaps provide (in the absence of an official poverty line) some idea of what the government itself takes to be the minimally acceptable income of a worker. We have divided this wage (Rs 16,000 per month) by 4 to derive a per capita estimate for a family of 4. Clearly, even the average rural consumption is below that minimum figure.
Figure 1.
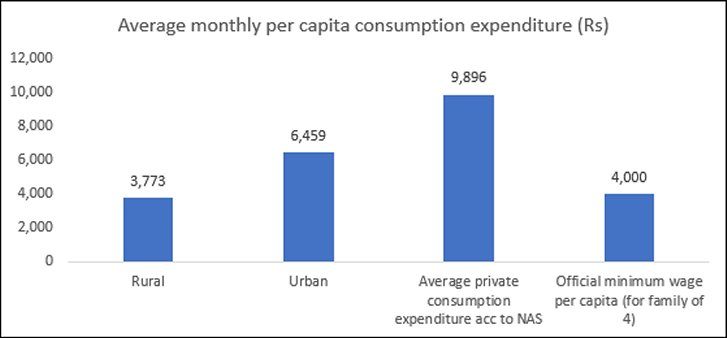
Figure 2.
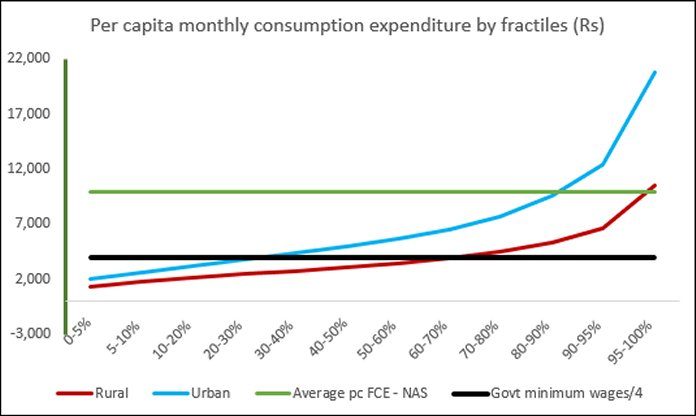
Figure 2 considers the distribution of consumption across fractiles of the population, in relation to these two numbers of average per capita private consumption from the National Accounts Statistics, and the minimum government wage providing for a family of 4. The results are startling. Fully 70 per cent of rural people and 30 per cent of urban residents fall below this line, suggesting that these are people who would probably be considered to be poor in any other country. Meanwhile, only the top 5 per cent of rural population and top 10 per cent of the urban population show per capita consumption higher than the national average as calculated from the national accounts. This provides yet more ammunition to the arguments against using per capita GDP as an indicator of the genuine material conditions of the population, and especially of the bottom half of the distribution.
Figure 3a
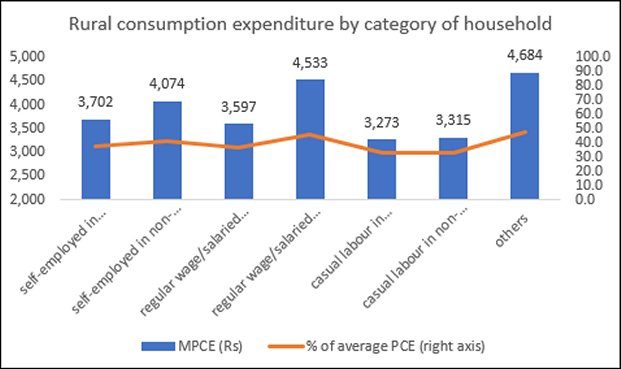
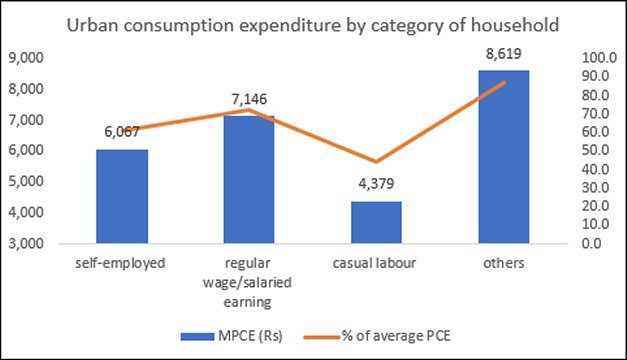
Figure 3b
Figures 3a and 3b describe per capita consumption by different groups based on the occupation of the household head. Some of these numbers are truly disturbing. The average consumption per person of farming families (self-employed in agriculture) is only Rs 3702 per month, well below the national average even in this household survey, and only 41 per cent of the average private consumption of the national accounts. Families of casual agricultural workers fare even worse, with the lowest per capita consumption among all groups, of only Rs 3273 per month. This is proof, if any more were required, that the concerns and demands of the farming community that are being expressed in the current protests are quite justified. But the overall depressed state of the rural economy is evident in the relatively low consumption of all groups except the residual category of “others”.
In urban areas, families of casual labourers have the lowest per capita consumption, around half that of “others”, but regular wage/salary earners also show relatively higher consumption. Even so, these are still below the national average private consumption as described by the national accounts.
Figure 4.
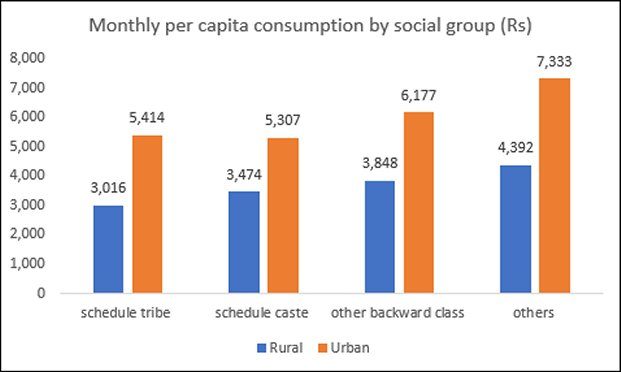
Finally, consider the monthly per capita consumption by social group, as shown in Figure 4. It is evident that caste-wise variations remain strong in both rural and urban India. This also adds fuel to the demand for a caste census that would provide further much-required detail on the actual social and economic conditions of different castes. It would be important to include castes of all communities (not just Hindus) in such a survey, and also pay attention to the condition of religious minorities.
Overall, the very summary results of this latest survey point to significant inequalities in consumption across different dimension of income, class, occupation and social category. In fact, this inequality is likely to be hugely underestimated because of undercounting the consumption of the rich. These are the issues that should concern policy makers.
(This article was originally published in the Business Line on March 4, 2024)